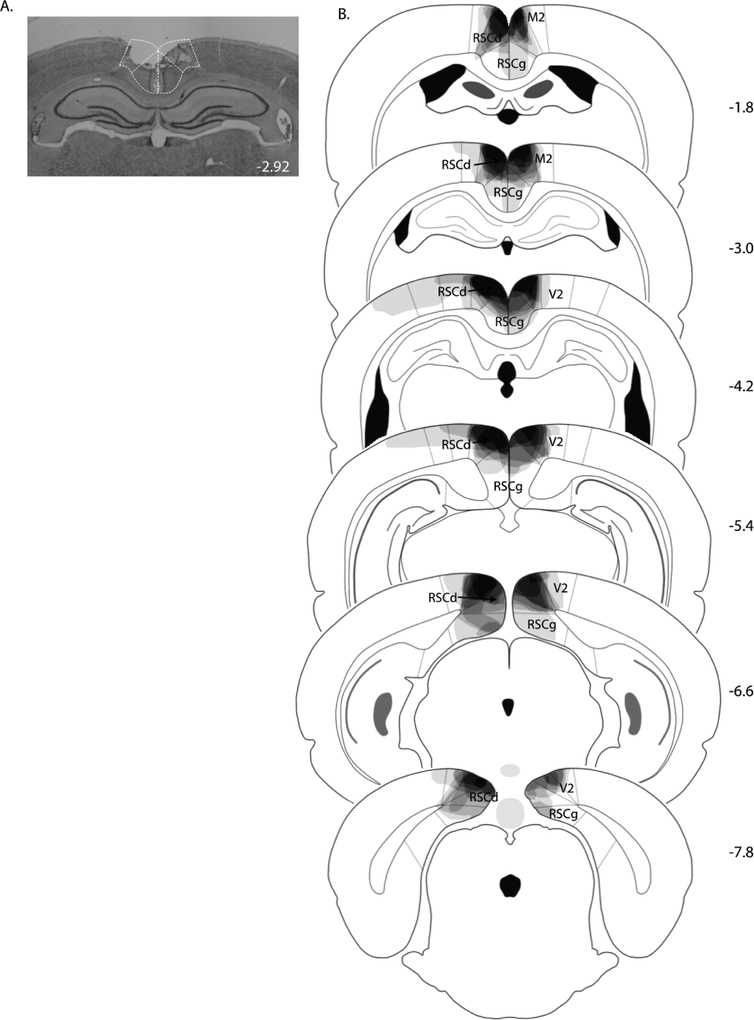
Figure 3.
(A) Photomicrograph of a representative RSC lesion in Experiment 2. (B) Drawings of lesions at six levels along the rostro-caudal extent of the RSC. At each level, lesion drawings were stacked onto a single image. The darkness of an area indicates the number of lesion cases that include that area. Abbreviations as in Figure 1.

