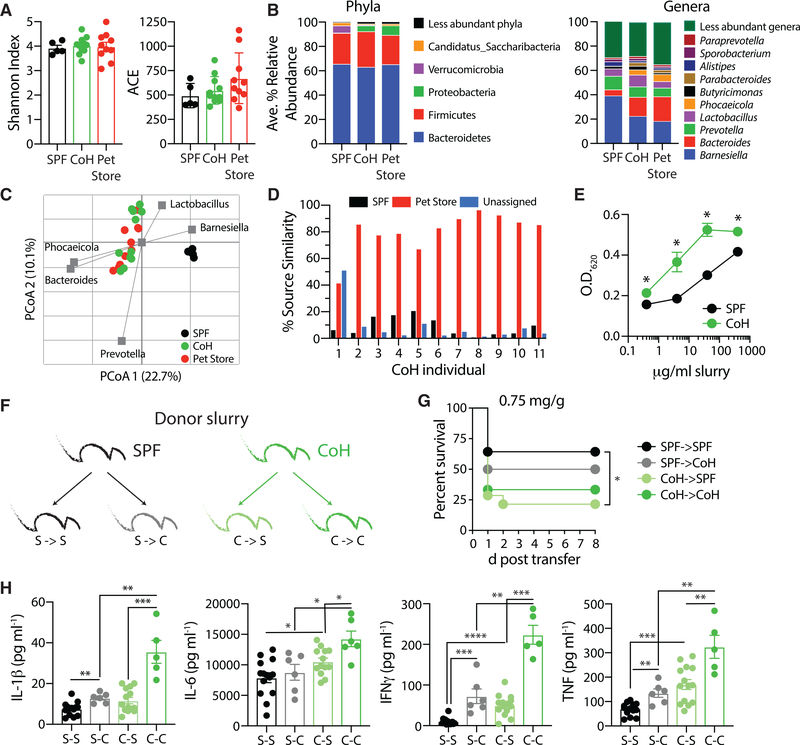
Figure 5. Characterization of the Microbiome in Cohoused Mice.
(A) Mean alpha diversity indices (±SE) in mouse fecal samples. Shannon and ACE indices are shown on the left and right, respectively. n = 5 SPF, 11 cohoused, and 10 pet store samples.
(B) Distributions of abundant phyla and genera in mouse fecal samples. Less-abundant genera accounted for a mean of ≤2.2% of the community, among all samples.
(C) Principal coordinates analysis (PCoA) of Bray-Curtis distances (r2 = 0.47). The five most abundant genera were correlated with axes position, where positioning near sample groups indicates a greater relative abundance of that genus.
(D) Similarity of cohoused B6 mice to SPF B6 and pet store mice, determined by SourceTracker.
(E) Cecal contents from SPF or cohoused B6 mice (n = 5of each) were cultured with the TLR4 reporter cell line, HEK-Blue hTLR4. TLR4 activation was quantified after 24 h with indicated concentration of cecal material. Data are representative of 3 technical replicates.
(F) Cecal contents were harvested from SPF or cohoused B6 donor mice to challenge recipient mice in the following combinations: S-S, SPF cecal slurry transferred to SPF recipients (n = 14); S-C, SPF cecal slurry transferred to cohoused recipients (n = 6); C-S, cohoused cecal slurry transferred to SPF recipients (n = 14); and C-C, cohoused cecal slurry transferred to cohoused recipients (n = 6).
(G) Survival curve of mice after i.p. injection with 0.75 mg/g body weight of cecal slurry as indicated in (F).
(H) Serum cytokine levels 6 h post-cecal slurry injection was determined by bioplex.
Data in (G) and (H) are pooled from 2 technical replicates. *p ≤ 0.05, **p ≤ 0.01, ***p ≤ 0.005, ****p ≤ 0.001.
See also Figure S3.

