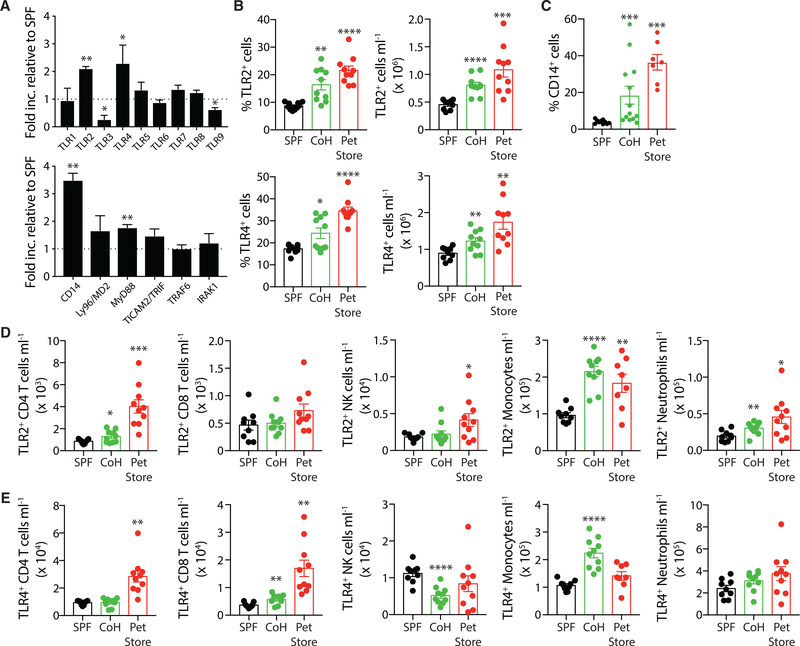
Figure 6. TLR2 and TLR4 Expression Is Increased after Physiological Microbial Exposure.
(A) The qPCR analysis of TLRs and TLR signaling pathway components in the adherent myeloid cells isolated from spleens of SPF (n = 5) and cohoused (n = 5) B6 mice. Data are representative of 2 technical replicates.
(B) Frequency and number of TLR2+ or TLR4+ cells in the blood of SPF B6, cohoused B6, and pet store mice.
(C) Frequency of CD14+ cells in blood of SPF B6, cohoused B6, and pet store mice.
(D and E) Immune subset quantification of TLR2 (D) and TLR4 (E) expression by CD4 T cells, CD8 T cells, NK cells, monocytes, and neutrophils.
Data in (B)-(E) consist of 5–10 mice/group and are representative of 3 technical replicates. *p ≤ 0.05, **p ≤ 0.01, ***p ≤ 0.005.
See also Figure S4.

