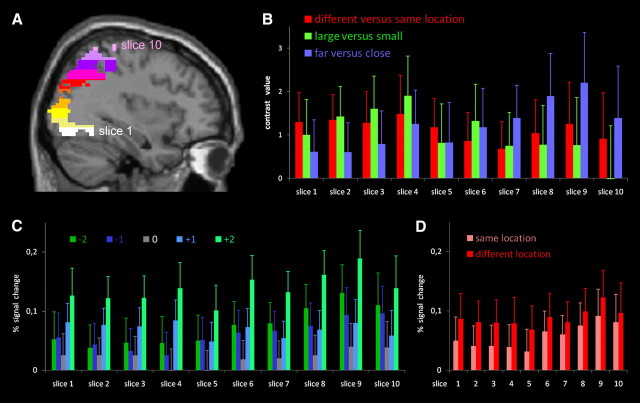
Figure 4.
A, ROI based on the contrast numbers versus baseline, restricted to the occipitoparietal cortex in the right hemisphere. This ROI was then divided in 10 equidistant slices along the z-axis, shown in different colors. B, Average contrast value for all voxels within each slice, for each contrast, averaged over subjects. Since neither main effect nor interactions with control were significant, values were averaged over both control conditions. C, Percentage signal change for each condition (numerical distance from habituation number: −2 to +2) in each of the ROI slices, averaged across location and control conditions. D, Percentage signal change for the same and different location conditions in each of the ROI slices, averaged across distance and control conditions.

