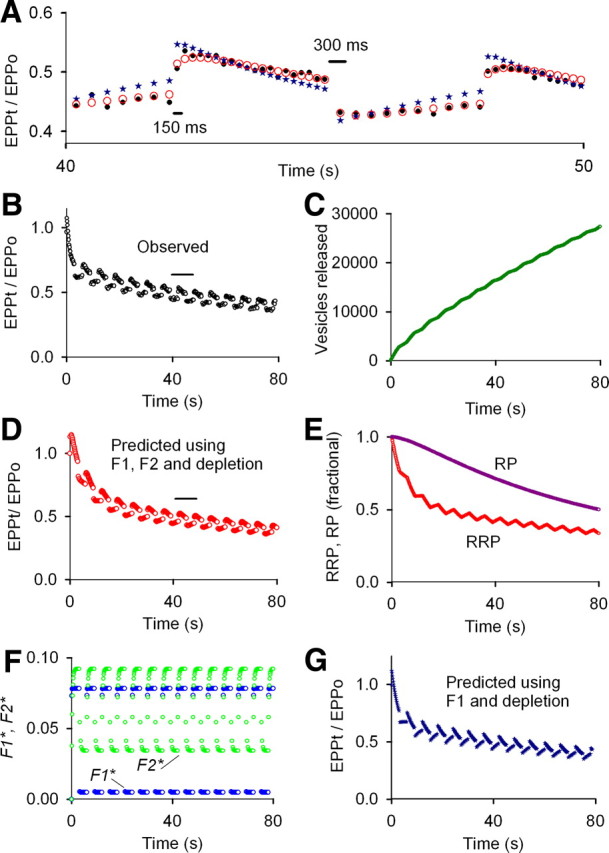
Figure 7.

Both F1 and F2 and marked depletion of the RRP contribute to STP during the slow phase of rundown for low stimulation rates at normal prob0 (2.0 mm Cao2+). To examine STP at slower stimulation rates at normal prob0, the stimulation pattern was alternated between 6.67/s for 3 s and 3.33/s for 3 s for a total of 80 s of stimulation at an average stimulation rate of 5/s. Both F1 and F2 as well as depletion of the RRP were required to describe STP during the slow phase of rundown for slow stimulation at normal prob0, in contrast to F1 and depletion (Figs. 3–6) for higher stimulation rates at normal prob0. A, B, Experimentally observed EPP amplitudes are plotted as black circles for the train in B and for 40–50 s during the train in A. To look for STP during the slow phase of rundown, the least-squares error for fitting the data in B was calculated for EPPs 95–405 of the 405 impulse train, with the calculations proceeding from the start of the train. F1 and F2 (F, blue and green circles, respectively) and depletion of the RRP and RP (E) were found. The fitted parameters described STP after step changes in stimulation rate during the slow phase of rundown (A, D, red circles), but the predicted fast phase of rundown was slower than the observed (compare D, B). In contrast, fitting EPPs 1–395 revealed only F1 and depletion, and predicted the fast phase of rundown during the first 3 s of the train (G), but not the response to step changes in stimulation rate during the slow phase of rundown (compare observed data as black circles in A and B, with predicted response as blue stars in A and G). Estimates of A and P were zero for fitting either the full train or the partial train (data not shown). Parameters for fitting EPPs 95–405, which gave the predicted responses in A (red circles) and C–F are as follows: EPP0 = 124 vesicles, prob0 = 0.0124, f1* = 1.10, τF1* = 55.2 ms, f2* = 0.0635, τF2* = 285 ms (fixed), n = 1.29, a0* = 0.0, p* = 0.0, RRP0 = 10,000 vesicles (fixed), τRRP = 14.5 s, RP0 = 33,243, τRP = 173 s. These same parameters could predict the STP to the full length of the train of 800 EPPs (data not shown). Parameters for fitting EPPs from 1 to 395 giving the predicted response plotted as blue stars in A and G: EPP0 = 231 vesicles, prob0 = 0.0231, f1* = 2.00 (limited to ≤2.0), τF1* = 57.2 ms, f2* = 0.0, n = 1.0 (fixed), a0* = 0.0, p* = 0.0, RRP0 = 10,000 (fixed), τRRP = 6.17 s, RP0 = 93,830 vesicles, τRP = 93.8 s.
