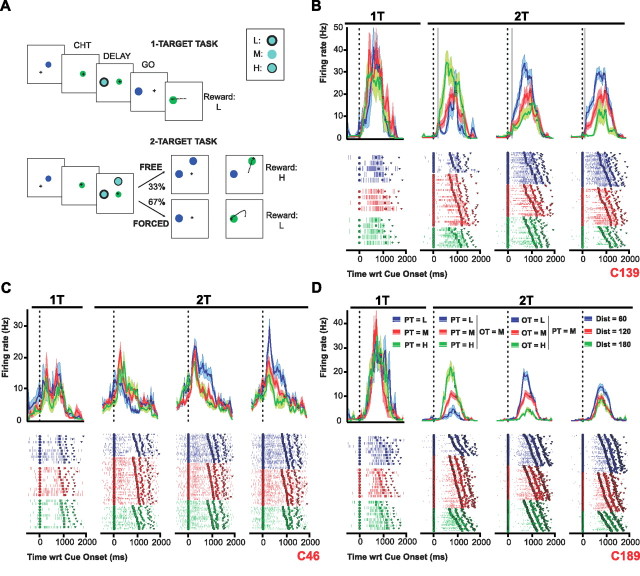
Figure 1.
A, Behavioral task. B–D, Three individual cell examples. Each panel shows histograms and raster plots for 1T and 2T trials in which the cell's PT was present. Activity is aligned on cue onset. The go signal, movement onset, and movement offset are indicated by thick squares, circles, and triangles, respectively. In the first column (1T task), colors indicate whether the PT value was low (blue), medium (red), or high (green). In the second column (2T) task, the PT values were low (blue), medium (red), or high (green), and there was also a medium-valued OT present. In the third column, the PT was always medium-valued while the OT value was low (blue), medium (red), or high (green). In the fourth column, both the PT and OT were medium-valued, but the OT was 60° (blue) 120° (red), or 180° (green) away from the PT. The vertical gray lines in B indicate the time when this cell's activity became statistically different (p < 0.01) in blue versus green conditions.

