Figure 2.

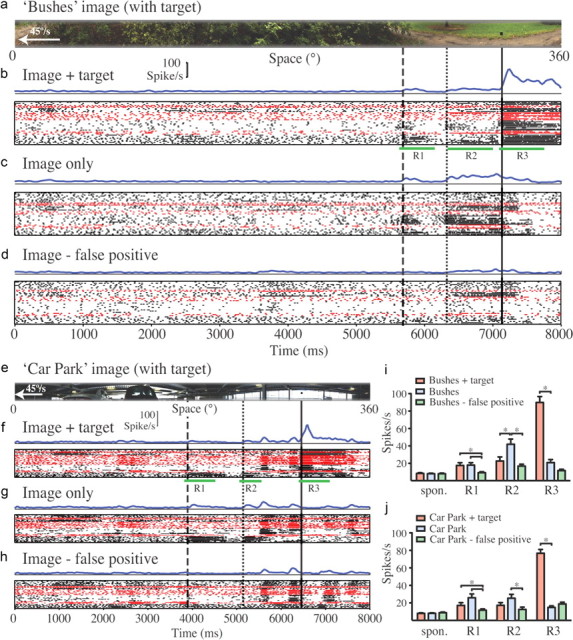
Electrophysiological responses of CSTMD1 to image strips moved at 45°/s from right to left across the frontal visual field. All responses are represented by average spike histograms (blue lines), raster plots where dots represent individual spikes recorded, and rows representing presentations of the same stimulus. Individual CSTMD1 neuron recordings from seven different animals' cells are distinguished by alternating black and red symbols. a, The strip from the bushes natural scene presented in physiological recordings, shown in alignment with recorded responses (see Results). b, Neural responses to the scene with the inclusion of an optimal target. R1, R2, and R3 denote peristimulus periods used for analysis of responses as three features identified by vertical lines passing through the receptive field center. The dashed line and R1 are aligned with the false-positive leaf feature (Fig. 1b,c). The dotted line (R2) is aligned with the base of a tree trunk (Fig. 1b) that was not altered during experiments. The solid vertical line (R3) is aligned with the embedded target feature. c, Responses to the original image. Some neurons respond to the false-positive feature (R1) and the tree base (R2). d, Responses to the image after digital manipulation to remove the false-positive feature (dashed line and R1). e–h, Similar analysis for the car park scene from a manmade environment. Note more transient responses to the target (R3) in f compared with same feature in the bushes image (b). Some neurons respond to the false-positive feature (at R1 in f and g) and to column features around R2 (dotted line). i, j, Summary analysis for each of the three image versions and both scenes, averaged across all seven neurons (between 37 and 51 repetitions for each image) and within the windows identified by R1–R3. *p < 0.05 (two-tailed t test with Bonferroni multiple comparisons, following one-way ANOVA) for comparison of response changes within each subregion (R1–R3) between images.
