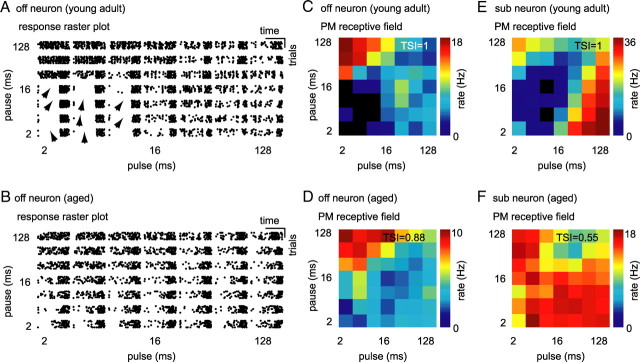
Figure 3.
Single-neuron responses to pulse matrix. A, Raster plot of an offset neuron from a young adult animal. This neuron responded preferentially to pulse trains of short pulse and long pause durations; it was not driven by stimuli of short pulse and short pause duration. Stimuli that suppressed response are indicated by arrows. B, Raster plot of an offset neuron (off) from an aged animal. This neuron responded preferentially to pulse trains of short pulse and long pause durations, but it was also driven by stimuli of short pulse and pause durations. Discharge of this neuron was not suppressed by any stimulus in our set. C, 3-D rate function (PM receptive field) of the offset neuron presented in A (young adult). Each square in the surface plot represents the average rate over nine repetitions of the pulse train. Discharge rate is color coded (black, no discharge; dark red, maximum discharge). TSI in the right top corner gives the difference between maximum and minimum discharge rate divided by the maximum discharge rate of the neuron in response to the pulse matrix. D, PM receptive field for the offset neuron presented in B (aged). E, PM receptive field for a sustained spontaneous (sub) neuron from a young adult animal. F, PM receptive field for a sustained spontaneous (sub) neuron from an aged animal. Note that discharges of young adult neurons presented in this figure were completely suppressed by a subset of pulse trains from the pulse matrix (TSI = 1), but the discharges of aged neurons were never completely suppressed (TSI = 0.55 and TSI = 0.88).

