
Figure 3.
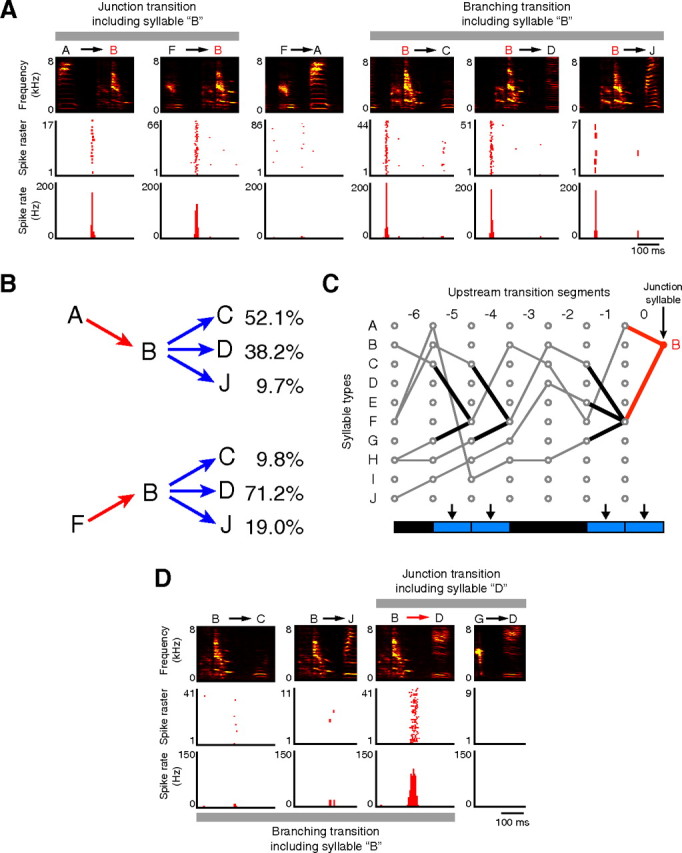
Syllable- and transition-selective activities, recorded from the bird that generated vocal sequences according to the syntactic rules illustrated in Figure 1A. A, Syllable-selective activity recorded from neuron 11 in Figure 2B. Top, Spectrograms. Middle and bottom, Raster plots and histograms, respectively, showing the spike patterns of neuron 11 while vocalizing the corresponding transition segments. Neuron 11 exhibited bursts with no statistical difference in spike rate between the junction transitions from syllable A to syllable B and from syllable F to syllable B (Kruskal–Wallis test, p = 0.79), and was almost inactive when vocalizing phrase FA instead of FB. The activity had no difference in spike rate among the branching transitions from syllable B to syllables C, D, and J (p = 0.96). B, The probability distribution of syllable transitions is altered depending on the sequence history. Transition probabilities of the individual trajectories are indicated on the right. C, Contextual differences of up to six transitions upstream had no effect on the burst spikes of neuron 11, generated in the segment including syllable B. Three different junction transitions (black lines) formed alternative trajectories toward the junction transition segment including syllable B (red line). The effects of the difference in upstream trajectories on the spike rate were statistically analyzed. The p value among alternatives was plotted using color in a rectangular cell below the corresponding junction transition segment (arrow). Blue, p ≥ 0.05; black, linear transition segment. Note that not all of the possible syllable sequences composed according to the transition diagram (Fig. 1A) were observed, because the transition probabilities change depending on the sequence history, as shown in B. D, All-or-none type transition-selective activity recorded from neuron 1 in the same animal as in A. According to the transition diagram (Fig. 1A), syllable transition from syllable B to syllable D is one of the alternative transitions including the branching syllable B and the junction syllable D. Top, Spectrograms. Middle and bottom, Raster plots and histograms. Activity profiles are statistically different in rates between junction transitions BD and GD (p = 3.4 × 10⁻⁵) and among branching transitions BC, BD, and BJ (p = 1.2 × 10⁻¹⁰).