Figure 2.

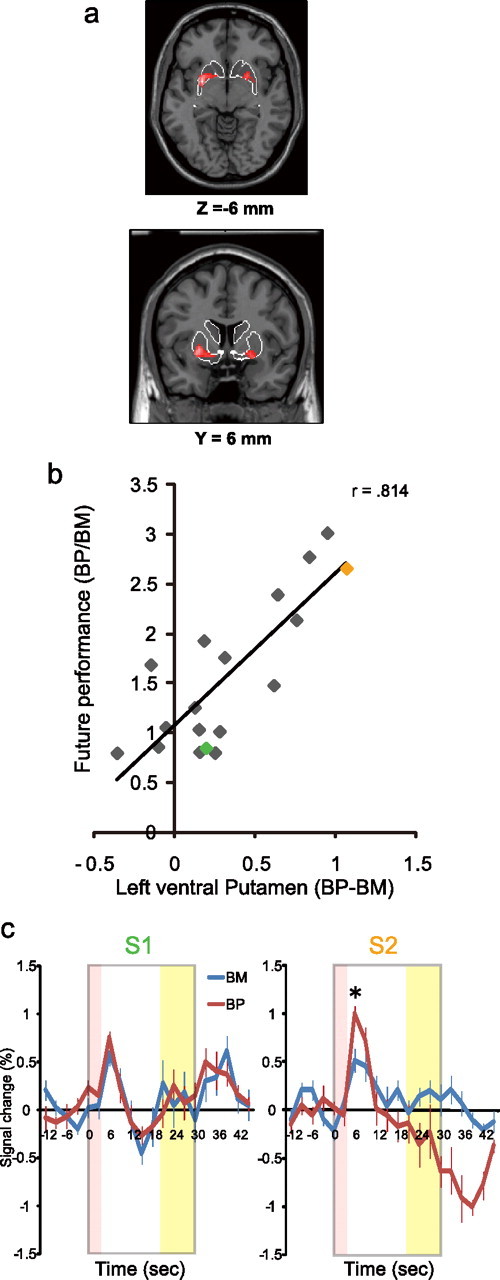
a, Results of the simple correlation analysis in the bilateral anterior putamen. The white contour is the predefined anatomical ROI (the striatum). b, A plot of the data from all subjects showing that the individual parameter estimation of BP > BM for the cluster representing the left anterior putamen (horizontal) was strongly correlated with future motor performance (vertical). The green point corresponds to S1. The orange point corresponds to S2. c, Time course plot of the left anterior putamen in Figure 2a (cluster size = 132 in the left side; local max = −26, 2, −6) in the BM (blue) mode and the BP (red) mode for S1 (skilled, left) and S2 (unskilled, right). The gray frame corresponds to a 30 s movement epoch. The error bars show the SE. *p < 0.05.
