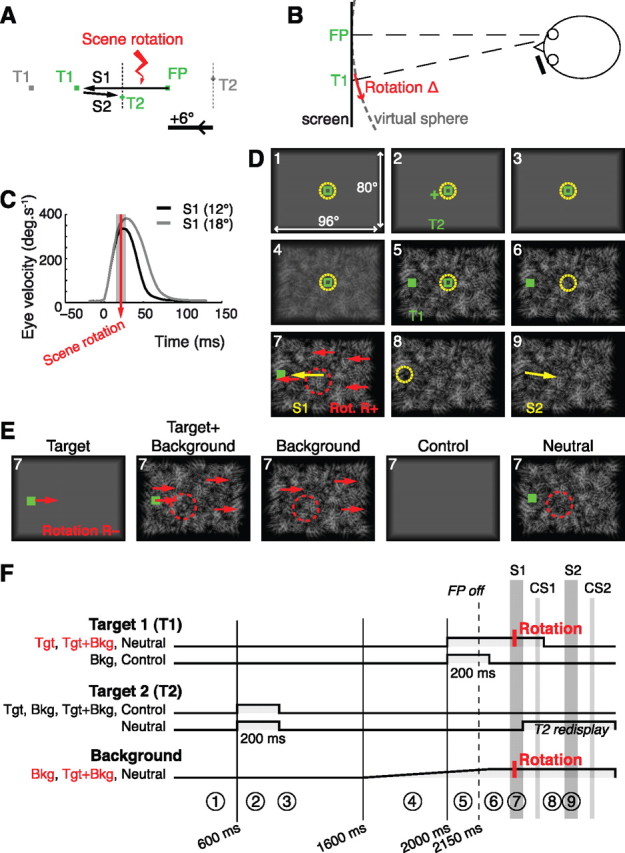
Figure 1.

Experimental protocol. A, Spatial configuration of the targets with an example of eye trajectory. Gray, Alternative positions for T1 and T2; dotted segments, range of T2 locations. The visual perturbation (rotation of the visual scene) took place during S1. To ease understanding, the positive x-axis was oriented to the left, in the direction of the first saccade. B, Top view of the experimental setup. The scene was rendered on a virtual sphere centered on the viewing eye. Perturbations were rotations of angle ±Δ of the virtual sphere. C, Precise timing of the visual perturbation relative to mean eye velocity profiles. Grayed area, 95% confidence interval on perturbation timing. D, Representative trial, in the condition Target+Background, for a positive intrasaccadic rotation. Numbers indicate the order of events. Targets are shown in green, eye position as a dashed yellow circle, saccades as yellow arrows, and intrasaccadic perturbation as red arrows. The dashed red circle denotes the scrambling of the background around the T2 location. For clarity, the distance between targets and the amplitude of rotation were exaggerated. E, For each of the five experimental conditions are depicted the events occurring during the saccade S1. Conditions with perturbation are here represented with a negative intrasaccadic rotation. F, Timing of stimulus presentation in the different conditions. Only conditions in red include trials with visual perturbations. Circled numbers refer to the trial steps of D. T2 was displayed before T1; T2 was always flashed, whereas T1 was sometimes maintained until 100 ms after the S1 saccade. In the condition neutral, T2 was redisplayed after S1 to guide the execution of S2. When a textured background was present, it was gradually introduced before T1.
