Figure 2.
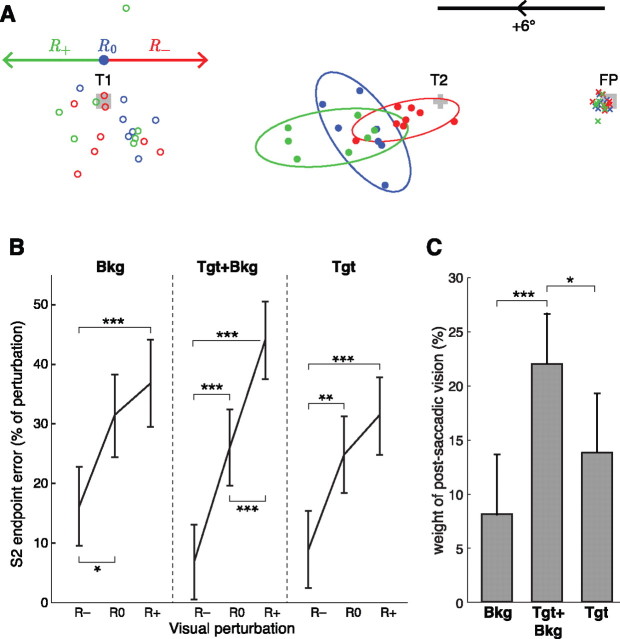
A, Raw endpoint data for one subject and one target configuration in the condition Target+Background. Crosses, Initial fixation; open circles, S1 endpoints; filled circles, S2 endpoints. The 95% tolerance ellipses are figured for the S2 endpoints. Red, Perturbation R−; blue, no perturbation R0; green, perturbation R+; gray, visual targets FP, T1, and T2 (drawn to scale). Arrows show the direction and amplitude of the scene rotation in the respective conditions. To synthesize data as presented below (B), raw S2 endpoint errors were pooled for the four target configurations by considering endpoint errors as a percentage of the potential perturbation amplitude. Note that the baseline used to compute the weight of postsaccadic vision (C) corresponds to the mean R0 error. B, Mean effect of the visual perturbation on the eye position at the end of S2. Error bars are 95% confidence intervals, ANOVA on S2 endpoint errors with factors perturbation, condition, target configuration, and subject. Endpoints are shown as errors relative to actual T2 location, expressed as a percentage of the potential (R0) or actual (R+, R−) visual perturbation amplitude Δ. Endpoints were adjusted for the aforementioned covariates. *p < 0.05, **p < 0.01, ***p < 0.001. C, Mean weight of the postsaccadic visual information for the different visual scenes.

