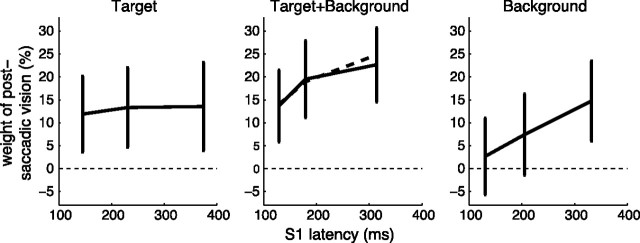
Figure 4.
Time course of the initial uptake of visual information. Weight of postsaccadic vision as a function of initial saccade (S1) latency for the three perturbation conditions. Data were binned by tertiles on S1 latency. Error bars indicate 95% confidence intervals computed from honestly significant difference multiple-comparisons tests after ANOVA. Dashed line, Prediction of the weight in Target+Background from values in the single Target and Background conditions (Eq. 10). The initial part of the dashed curve overlays the data.

