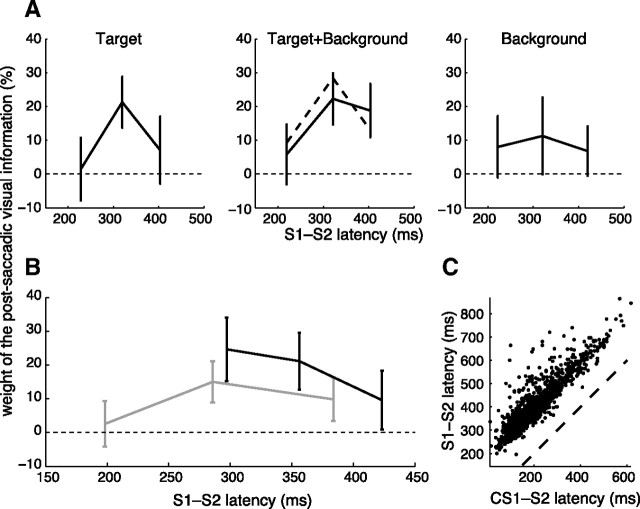
Figure 5.
Time course of the postsaccadic integration process. A, Weight of the postsaccadic visual information for different latencies between the end of S1 and the onset of S2 (S1–S2 latency). The different conditions of perturbation are represented separately, but with identical binning. Dashed line, Prediction of the Target+Background weight from weights in the single Target and Background conditions (Eq. 10). Error bars represent 95% confidence intervals. B, Weight of the postsaccadic visual information, separating trials with and without CS1. Gray, Trials without corrective saccade CS1 (conditions Target, Target+Background, and Background pooled). Black, Trials with CS1 (conditions Target and Target+Background pooled). C, Total S1–S2 latency as a function of CS1–S2 latency, for trials with CS1.

