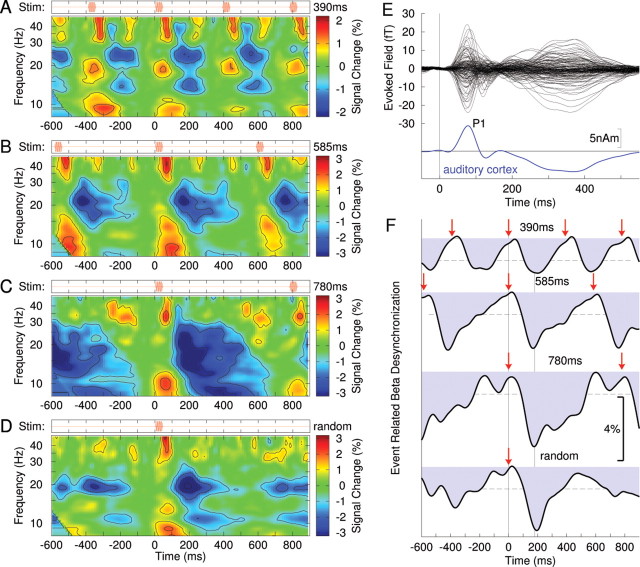
Figure 1.
Spectrotemporal dynamics of neuromagnetic activity recorded from right auditory cortex. All data shown are grand averages across the group of 12 participants. A, The time–frequency map of signal power changes related to stimuli repeatedly presented every 390 ms (top row) shows a periodic pattern of signal increases and decreases in various frequency bands. B–D, The time–frequency map for stimuli presented every 585 ms (B), every 780 ms (C), and the time–frequency map for randomly presented stimuli (D) show similar stimulus event-related pattern of signal power change. E, Auditory evoked magnetic field waveforms observed with 151 MEG channels (top) and the corresponding waveform of auditory cortex activation (bottom). Prominent wave is the P1 response with ∼80 ms peak latency. F, Time courses of beta-band power changes (20–22 Hz) show a signal decrease immediately after stimulus onset, which is termed the beta desynchronization. The red arrows mark the onsets of stimuli. The dashed horizontal lines indicate the 99% confidence limits for the group mean. The vertical line at t = 190 ms indicates the latency of largest beta desynchronization, which is similar for all stimulus condition.

