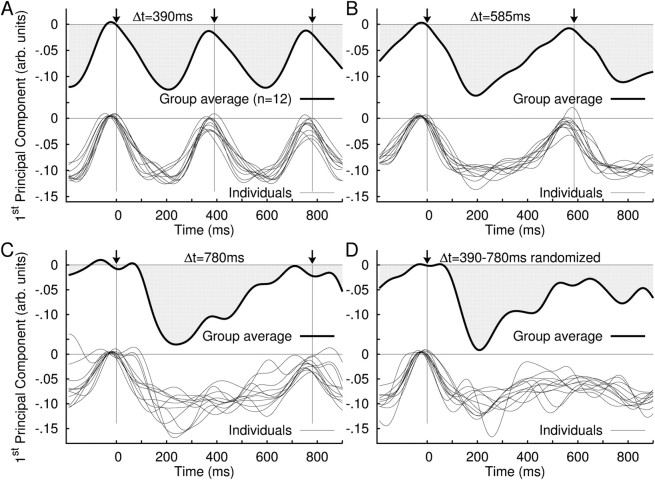
Figure 3.
Time series of the principal components of event-related modulation of beta oscillations. A spatiotemporal principal component analysis decomposed the source data of beta signal change into a set of PCs, consisting of a brain map and associated time series. The time series of the first PC (i.e., the largest) are shown in this figure. A–D, Overlay of the time series of the first PC for all individuals at 390 ms stimulus onset asynchrony (SOA) (bottom) and the first PC of the grand averaged data (top) (A); 585 ms SOA (B); 780 ms SOA (C); and randomized stimulus presentation (D).

