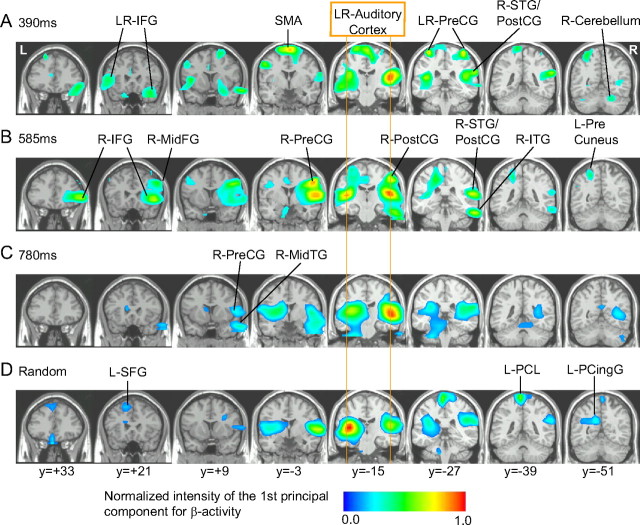
Figure 4.
Brain maps associated to the time series of the first PC of the beta amplitude shown in Figure 3 indicate the areas in which beta activity was modulated by the auditory stimuli. A–D, Stimulus interval: 390 ms (A), 585 ms (B), 780 ms (C), and randomized between 390 and 780 ms (D). Local maxima are indicated by arrows. The list of the locations and Talairach coordinates are indicated in Table 1. IFG, Inferior frontal gyrus; ITG, inferior temporal gyrus; MidTG, middle temporal gyrus; PreCG, precentral gyrus; PostCG, postcentral gyrus; PCingG, posterior cingulate gyrus; PCL, paracentral lobule; SFG, superior frontal gyrus; SMA, supplementary motor area.

