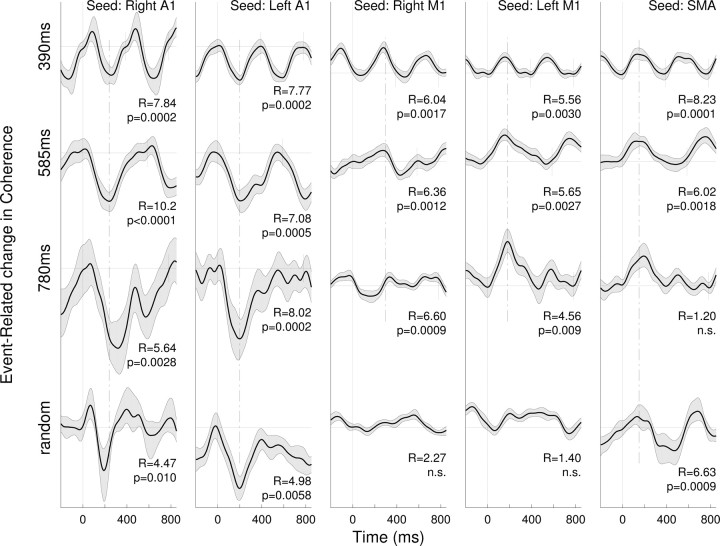
Figure 5.
Time series of event-related changes in cortico-cortical coherence of beta oscillations. Shown are the largest principal components resulting from spatiotemporal PCA on the coherence measure. Columns of time series are related to the seed locations for coherence analysis in the right Heschl's gyrus (A1) (Talairach coordinates: 45, −19, 14 mm), left Heschl's gyrus (−41, −24, 12), right precentral gyrus (38, −27, 62), left precentral gyrus (−34, −27, 64), and medial frontal gyrus, location of supplementary motor areas (2, −4, 72). Rows of time series relate to the different stimulus periodicity. The gray shaded areas denote the 95% confidence intervals for the group mean. The Rayleigh statistics R and corresponding p values indicate phase-locking of coherence changes to the stimulus.

