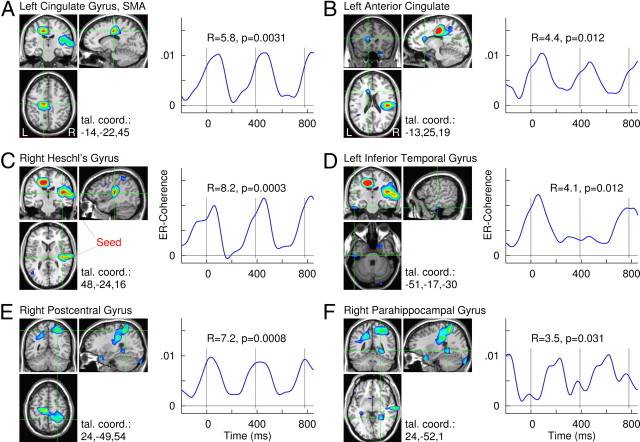
Figure 6.
Brain areas identified by event-related changes in beta coherence with the seed in the right Heschl's gyrus. A–F, Color-coded maps overlaid to a standard brain MRI show the Rayleigh statistics R, which indicates consistent changes in coherence according to the rhythm of auditory stimulation at periodicity of 390 ms. Brain areas with the largest local maxima of R values are shown with axial, coronal, and sagittal views, respectively. Corresponding time series of event-related change in beta coherence with the seed location are shown for the six local maxima. The time series exhibit periodic pattern according to the stimulus rhythm. The vertical lines indicate the onsets of auditory stimuli.

