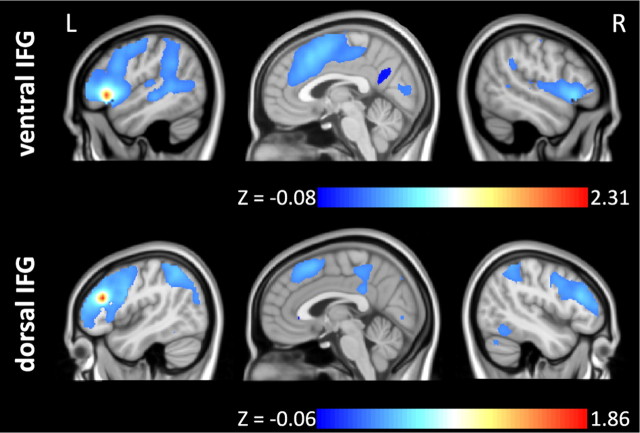
Figure 6.
Results of the seed-based functional connectivity analysis. Areas that show high correlations with the ventral IFG ROI and dorsal IFG ROI. For illustrative purposes z-values between 0 and 0.4 are omitted. R, Right; L, left. MNI coordinates of sagittal slices: ventral IFG x = −49/3/49; dorsal IFG x = −43/3/43.

