Figure 1.
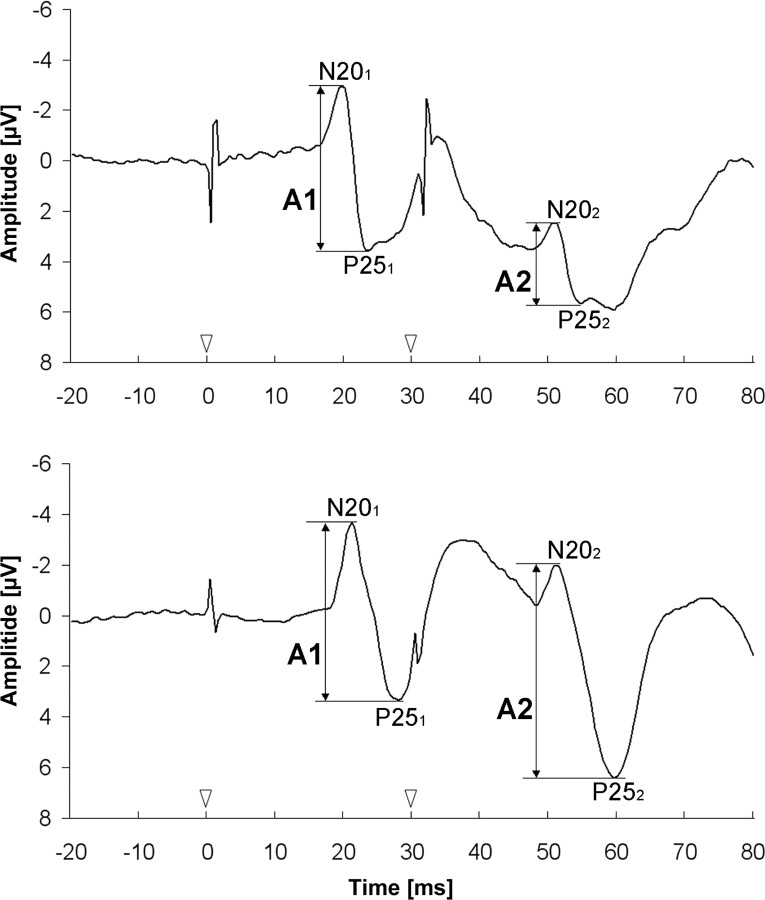
Cortical responses to paired-pulse stimulation at an SOA of 30 ms of one young (top) and one elderly (bottom) subject. Onset of stimulation is marked by white arrowheads. The N20–P25 amplitudes of the first (A1) and second (A2) response are marked by black arrows. Amplitude ratio = A2/A1. Note the small paired-pulse suppression in the example of the elderly subject (bottom).

