
Figure 7.
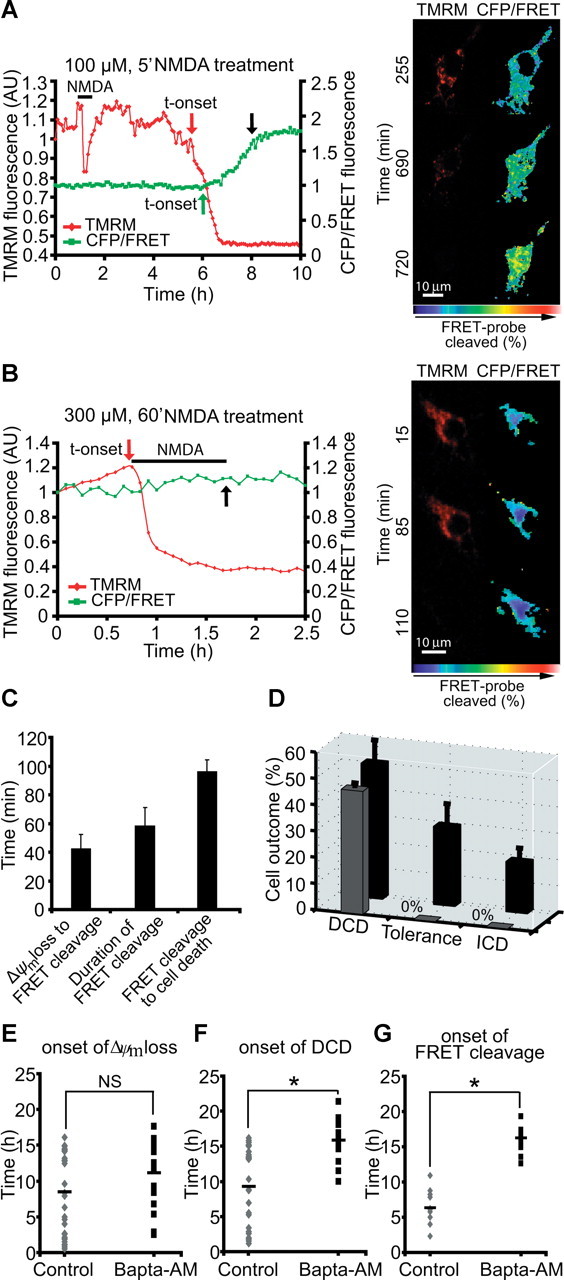
Calpain activation is selectively associated with excitotoxic apoptosis. A, B, Cortical neurons were transfected with the calpain-sensitive FRET probe and after 24 h mounted on the stage of a LSM 5Live duoscan, and neurons were treated with 100 μm NMDA for 5 min and assayed over 24 h (A) or 300 μm NMDA and assayed over 4 h (B). Fluorescent measurements were recorded for TMRM, FRET, CFP, and YFP by time-lapse confocal microscope. FRET probe imaging data are expressed as a ratio of CFP/FRET. TMRM was used as a Δψm indicator in the nonquenched mode. In neurons that showed a delayed excitotoxic apoptosis (A), we observed significant calpain activation (FRET probe cleavage) subsequent to delayed Δψm depolarization. In neurons that showed an immediate excitotoxic ICD/necrosis (B), no significant FRET cleavage was observed. The onset of these events (in red and green) and cell death (in black) is indicated by arrows (A, B), and representative time-frame images are illustrated (left, pseudocolored CFP/FRET emission ratio; red, TMRM images). Scale bar, 10 μm. C, Analysis of FRET probe cleavage and its relation to cellular outcome in cells treated with 100 μm NMDA for 5 min. Data shown represent the mean time taken between the onset of FRET probe disruption and onset of Δψm loss; the mean time taken for complete probe cleavage and the mean time taken between onset of FRET probe cleavage and onset of cellular collapse. Data were obtained from 18 separate experiments from 11 independent cultures (n = 22 neurons). D, Quantification of the number of cells in 100 μm NMDA/5 min treated neurons with FRET probe disruption (in black, total number of cells; in gray, cells with FRET probe disruption). Neurons were classified according to their type of cellular response (DCD, tolerance, ICD). Data were obtained from 18 separate experiments from 11 independent cultures (n = 47 neurons). E, F, Cortical neurons were exposed to 100 μm NMDA for 5 min and the Ca2+ chelator BAPTA-AM (500 nm) was added on stage 4 h after NMDA addition. Alterations in Δψm and intracellular Ca2+ were monitored in single cells using confocal fluorescence microscopy. Onset of Δψm loss (E) and onset of DCD (F) was analyzed in neurons in the absence (control, n = 29 neurons) or the presence of BAPTA-AM (n = 19 neurons). *p ≤ 0.05 compared with NMDA-treated control. G, Cortical neurons transfected with the calpain-sensitive FRET probe were treated as described in E and F and the onset of the FRET probe cleavage was analyzed in transfected neurons in the absence (control, n = 11 neurons) or presence of BAPTA-AM (n = 11 neurons). *p ≤ 0.05 compared with NMDA-treated control neurons.