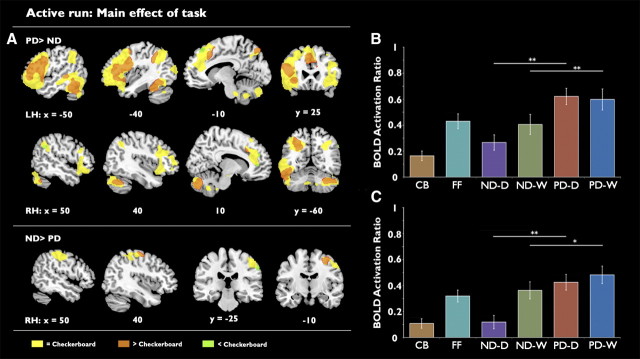
Figure 5.
A, Maps of activation showing the main effect of task. Top, Preferential activation for the number decision task. Bottom, Preferential activation for the phoneme decision task. Images are presented with a cluster-corrected threshold of z > 2.3, p < 0.01. B, C, Region of interest analysis showing mean activation for each of the experimental conditions in the anatomically localized left VWFA (B) and the functionally localized VWFA (C). Significantly stronger activation was observed for the phoneme decision task in both regions. **p = 0.001, *p < 0.05. LH, Left hemisphere; RH, right hemisphere; CB, Checkerboard; FF, False Font; ND-D, ND-Digits; ND-W, ND-Words; PD-D, PD-Digits; PD-W, PD-Words. Error bars are ±1 SEM. n = 19.

