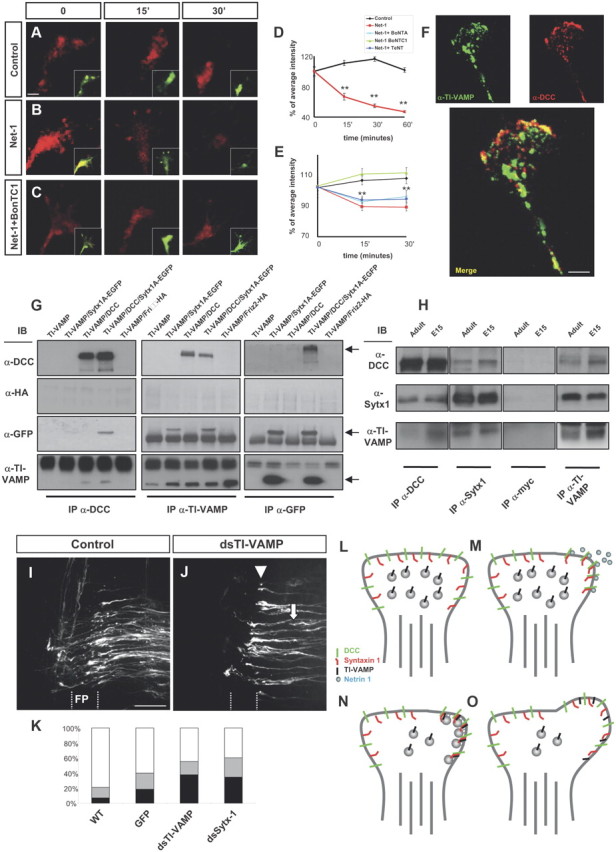
Figure 9.

Netrin-1 elicits exocytosis and axonal guidance depending on Sytx1 and TI-VAMP. A–C, Confocal images of live hippocampal growth cones traced with BODIPY (recorded in the red channel). Neurons were labeled with BODIPY ceramide for 30 min at room temperature and then chased for 2.5–3 h at 37°C. Growth cones were treated with control medium, Netrin-1, or Netrin-1 plus BoNT/C1 for 0–30 min. While fluorescent vesicle clusters persist in controls (A), red fluorescence rapidly disappears upon treatment with Netrin-1 (B), indicating the occurrence of secretion events. Treatment with BoNT/C1 prevents the disappearance of red puncta in Netrin-1-treated neurons (C). On the bottom right, merged images showing the BODIPY label recorded separately in the red (high concentration) and green (low concentration) channels. The red spots show Golgi-derived vesicles or vesicle clusters, whereas the green fluorescence outlines the plasmalemma of the growth cone, labeled with small amounts of BODIPY. D, E, Percentage of average intensity of red fluorescent puncta in growth cones for control and Netrin-1-treated hippocampal neurons (normalized to 100% at the onset of treatment) (D). The average intensity of spots recorded in the red channel comes back to control levels after treatment with BoNT/C1 (E). F, Confocal images of hippocampal growth cones immunolabeled for DCC and TI-VAMP. A merged image showing colocalization of both proteins is shown at the bottom. G, Coimmunoprecipitation experiments in HEK293 cells transfected with pCMV6TI-VAMP and Sytx1AEGFP, pCMVDCC, or Friz2-HA DNAs. DCC immunoprecipitation results in coassociation with Sytx1A, visualized with anti-GFP antibodies, and with TI-VAMP (anti-TI-VAMP antibodies). The reverse immunoprecipitation with anti-TI-VAMP antibodies confirms DCC and Sytx1 coimmunoprecipitation. GFP immunoprecipitation of Sytx1 reveals coassociation with DCC and TI-VAMP proteins. Immunoblots show no coimmunoprecipitation of Friz-2 with DCC and the SNAREs Sytx1 and TI-VAMP. H, Coimmunoprecipitation experiments in E15 and adult brain lysates. Sytx1 and TI-VAMP immunoprecipitation yields coimmunoprecipitation of DCC in both samples. DCC and TI-VAMP immunoprecipitation yields coassociation of Sytx1. DCC and Sytx1 immunoprecipitation yields coassociation of TI-VAMP. Immunoprecipitations with anti-myc antibody were used as controls. I, J, Confocal images showing open-book preparations from the chicken spinal cord. The injection of the control pIRES-EGFP construct did not interfere with commissural axon pathfinding (I). Downregulation of TI-VAMP using in ovo RNAi (J) interfered with commissural axon navigation to and across the floor plate, with many fibers being arrested before (arrows) or within the floor plate (FP) (arrowheads). K, Quantification of the axon guidance phenotype in open-book preparations of embryonic chicken spinal cords. RNAi-mediated downregulation of TI-VAMP in chicken spinal cords (n = 139 injection sites in 17 embryos) yielded similar commissural pathfinding errors to those obtained with silencing of Sytx1 (n = 135 injection sites in 18 embryos). We observed strong phenotypes at 37.9% of dsTI-VAMP and 34.6% of dsStx-1, and weak phenotypes at 17.2 and 25.7% of injection sites, respectively. By contrast, electroporation of a pIRES plasmid expressing EGFP under the β-actin promoter (297 injection sites in 28 embryos; 60.1% normal and 21% weak phenotypes) did not differ significantly from untreated controls (6.9% strong phenotypes, 13% weak; n = 489 injection sites in 47 embryos). L–O, Schematic diagram summarizing a model for the regulation of Netrin-1-dependent exocytosis in growth cones. In a steady-state situation, the growth cones present a low release of exocytosis vesicles (L). Netrin-1 activation of DCC receptors result in ligand-dependent clustering of DCC/Sytx1 complexes in activated membrane domains (M). Here, the formation of a SNARE complex between Sytx1 and TI-VAMP proteins occurs, thereby promoting exocytosis of vesicles at DCC-activated domains (N), resulting in membrane expansion (O). Significant differences are labeled by asterisks (**p ≤ 0.001). Scale bars: A, 2 μm; F, 3 μm; I, 50 μm. Error bars indicate SEM.
