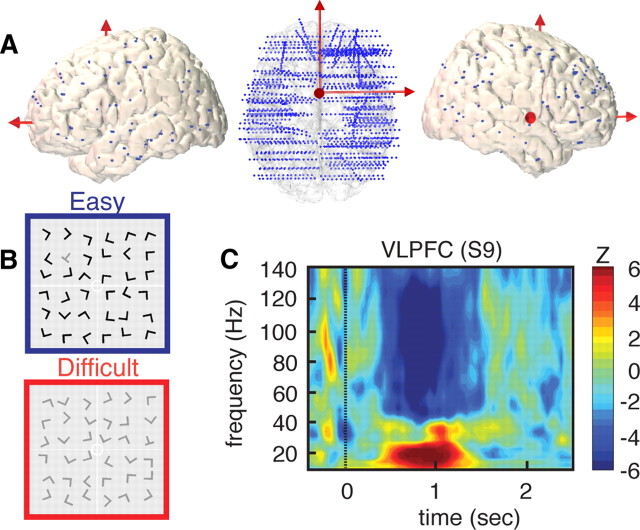
Figure 1.
High-density depth electrode recordings during visual search. A, Left, Top and right side views of implanted electrode locations represented on a 3-D reconstruction of a standard (MNI) brain. Blue dots represent the Talairach coordinates for all contacts on all SEEG electrodes for all 14 subjects (total = 1730 recording sites). B, Example of visual search arrays for easy (blue) and difficult (red) conditions (subjects were asked to find the T among the Ls). C, Strong power suppression in broad-band gamma (60–140 Hz) in right VLPFC during visual search. High gamma suppression also coincides with power increases in lower (<30 Hz) frequency range. The illustrative time–frequency map represent increases and decreases in spectral power compared to a prestimulus baseline level (baseline, [from −400 to −100] ms, Wilcoxon Z value).

