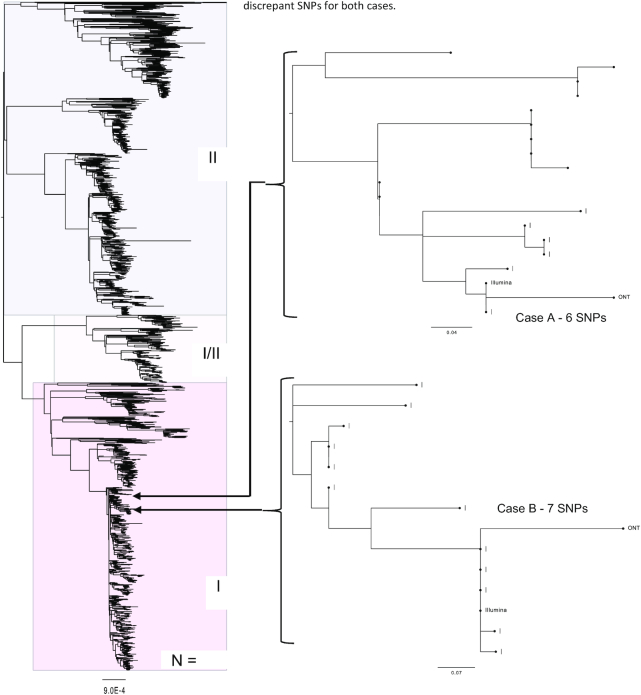
Figure 6:
Maximum likelihood tree, of a “soft core” alignment of 4,475 genomes showing the tree lineages (I, I/II, and II) of STEC (Clonal Complex 11). Also showing where Oxford Nanopore and Illumina sequencing data are placed within the tree for each of the 2 cases. All methylated positions and prophage regions have been masked. Values represent the SNP differences between the Illumina and ONT data for both cases.

