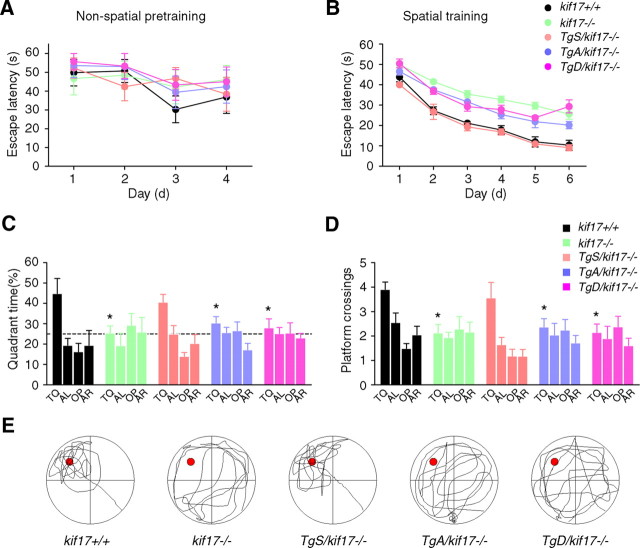
Figure 2.
Performance in the Morris water maze task. A, Escape latencies during non-spatial pretraining (four trials per day). B, Escape latencies during spatial training. C, D, Probe test performed 24 h after the last training sessions. The escape platform was removed, and mice were allowed to swim for 60 s. Target quadrant searching time (C) and platform crossings (D, the number of times the mice cross the exact location of the platform) were calculated to evaluate the spatial learning ability of mice. TQ, Target quadrant; AL, adjacent left; OP, opposite; AR, adjacent right. The quadrant time (percentage) in TQ was as follows: kif17+/+, 44.8 ± 7.4%; kif17−/−, 25.4 ± 3.5%; TgS/kif17−/−, 40.6 ± 3.8%; TgA/kif17−/−, 30.4 ± 3.1%; TgD/kif17−/−, 27.9 ± 4.4%. The platform crossings were as follows: kif17+/+, 3.9 ± 0.3%; kif17−/−, 2.1 ± 0.3%; TgS/kif17−/−, 3.6 ± 0.6%; TgA/kif17−/−, 2.3 ± 0.4%; TgD/kif17−/−, 2.1 ± 0.3%. Values represent mean ± SEM (n = 8 mice/genotype, *p < 0.05; one-way ANOVA and post hoc test). E, Representative searching strategy during the probe test. Kif17+/+ and TgS/kif17−/− mice focused their search in the target quadrant, while kif17−/−, TgA/kif17−/−, and TgD/kif17−/− mice navigated over the entire area of the pool.

