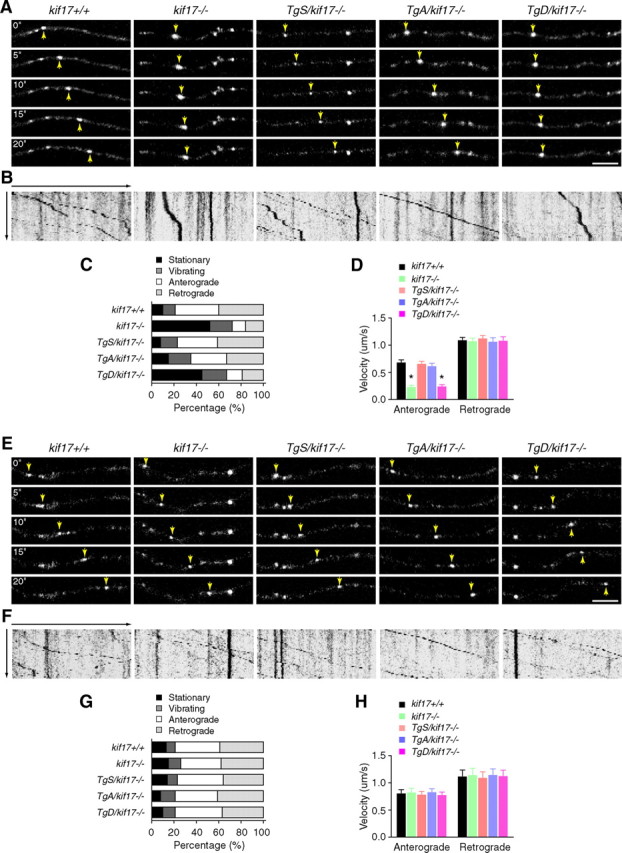
Figure 4.

Dynamics of GluN2 subunits in live hippocampal neurons. A–D, Analysis of GluN2B motility. A, Time-lapse images of movement of GluN2B-RFP clusters in dendrites. Arrows point to anterogradely moving clusters. Scale bar, 5 μm. B, Kymograph showing the motility of GluN2B clusters. C, Classification of motility (p < 0.0001; χ2 test). D, Average velocities for anterograde and retrograde movement of GluN2B clusters. E–H, Analysis of GluN2A motility. E, Time-lapse images of movement of GluN2A-RFP clusters in dendrites. Arrows point to anterogradely moving clusters. Scale bar, 5 μm. F, Kymograph showing the motility of GluN2A clusters. G, Classification of motility (p = 0.90, χ2 test). H, Average velocities for anterograde and retrograde movement of GluN2A clusters. Data are expressed as mean ± SEM (n = 48 neurons from three animals/genotype, *p < 0.05; one-way ANOVA and post hoc test).
