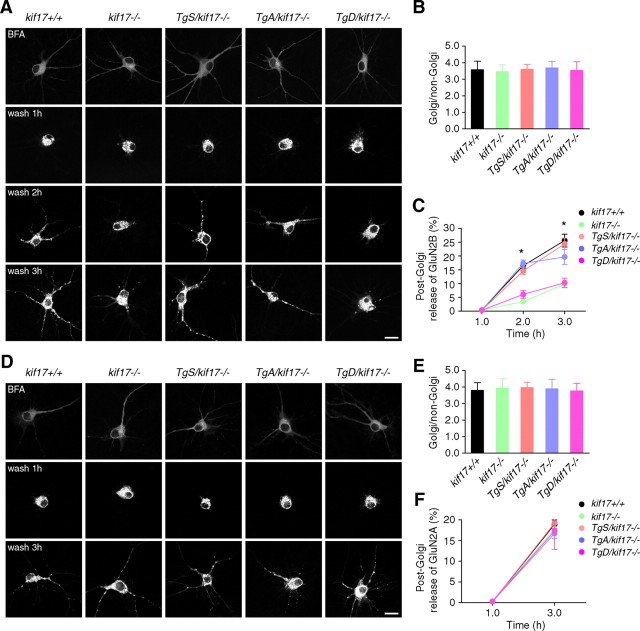
Figure 5.
ER-to-Golgi and post-Golgi transport of GluN2 subunits in neurons. A–C, Dynamics of GluN2B-RFP after BFA washout. A, Hippocampal cultures were cotransfected with untagged GluN1–1a together with GluN2B-RFP vectors. After BFA washout, images were acquired at indicated time points. Scale bar, 20 μm. B, Fluorescence intensity of the Golgi and non-Golgi were expressed as ratios at 1 h after BFA washout (mean ± SEM, p > 0.05; one-way ANOVA and post hoc test). C, Percentage of released GluN2B-RFP signals from the Golgi region (mean ± SEM, *p < 0.05; one-way ANOVA and post hoc test). For quantification, 15 neurons from three mice of each genotype were examined. D–F, Dynamics of GluN2A-RFP after BFA washout. D, Hippocampal cultures were cotransfected with untagged GluN1–1a together with GluN2A-RFP vectors. After BFA washout, images were acquired at indicated time points. Scale bar, 20 μm. E, Fluorescence intensity of Golgi and non-Golgi were expressed as ratios at 1 h after BFA washout (mean ± SEM, p > 0.05; one-way ANOVA and post hoc test). F, Percentage of released GluN2A-RFP signals from the Golgi region (mean ± SEM, p > 0.05; one-way ANOVA and post hoc test). For quantification, 15 neurons from three mice of each genotype were examined.

