
Figure 9.
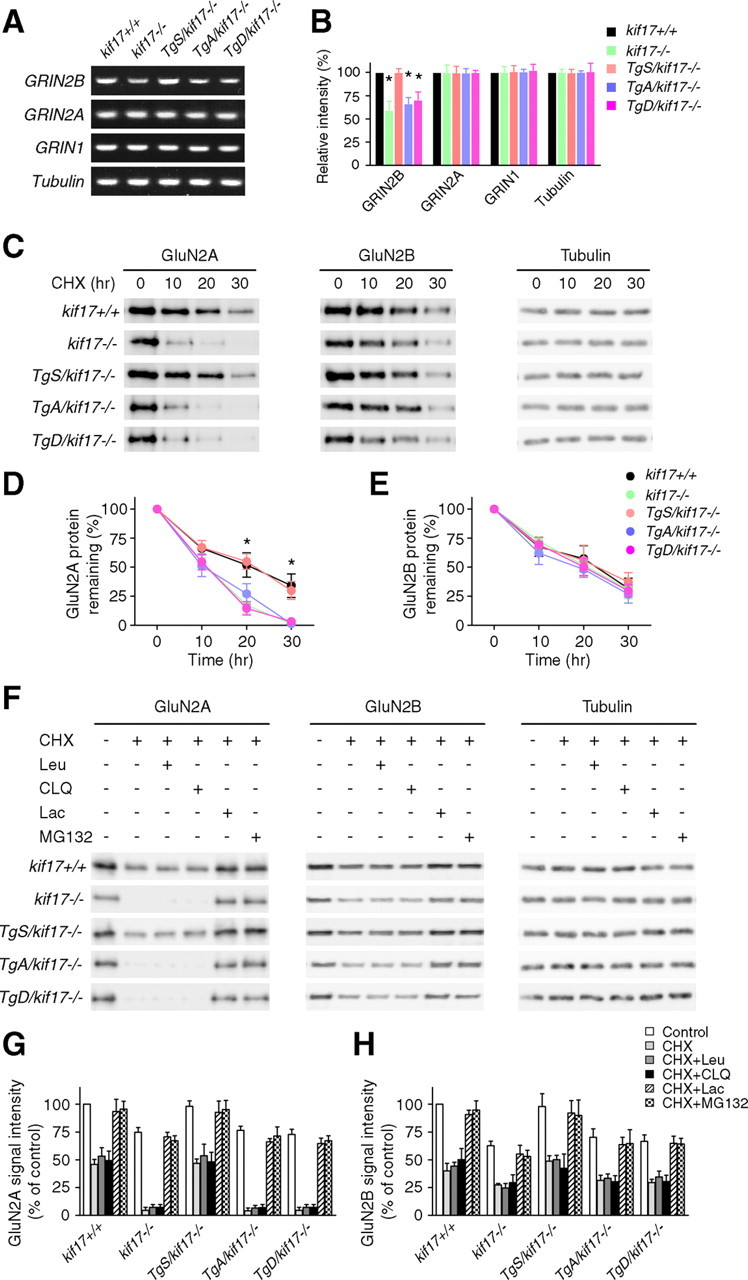
Receptor degradation analysis in hippocampal neurons. A, B, RT-PCR analysis of NMDA receptors in hippocampal extracts. Data are representative of three separate experiments. Values are expressed as mean ± SEM (*p < 0.05; one-way ANOVA and post hoc test). C, Representative immunoblots of levels of GluN2A and GluN2B in neurons treated with CHX (20 μg/ml) for 0, 10, 20, and 30 h, respectively. D, E, Quantification of GluN2A/2B degradation. Data were obtained from three independent experiments. Values are the average signal intensities (mean ± SEM) for GluN2A and GluN2B standardized to the signal intensity of tubulin and normalized to 100% at time 0 (*p < 0.05; one-way ANOVA and post hoc test). F, Representative immunoblots of levels of GluN2 subunits in neurons incubated with CHX for 20 h, in the presence or absence of lysosomal inhibitors (Leu, leupeptin, 100 μg/ml; CLQ, chloroquine, 200 μm), or proteasomal inhibitors (Lac, lactacystin, 10 μm; MG132, 10 μm). G, H, Quantification of changes in GluN2 subunits as shown in F, based on three independent experiments. Data are expressed as mean ± SEM.