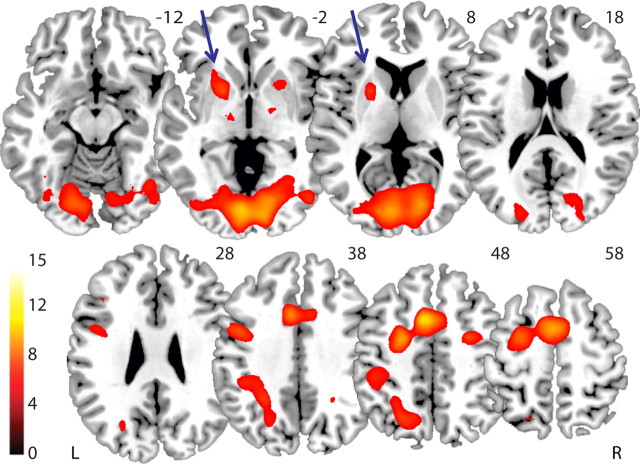
Figure 2.
Task network for stimulus switching. Main effect on BOLD signal during trial types that required switching between stimuli (stimulus-switch and stimulus/rule-switch) relative to trial types that did not require switching between stimuli (rule-switch and non-switch), with data pooled across TMS Time (pre-TMS vs post-TMS) and TMS Site (M1 vs medial parietal cortex). A cluster in the left putamen was defined as a volume of interest (indicated by arrows). Bar indicates t values, and figure is thresholded for a t value of 5.22, corresponding to a p value of 0.05 FWE corrected for multiple comparisons.

