Figure 4.
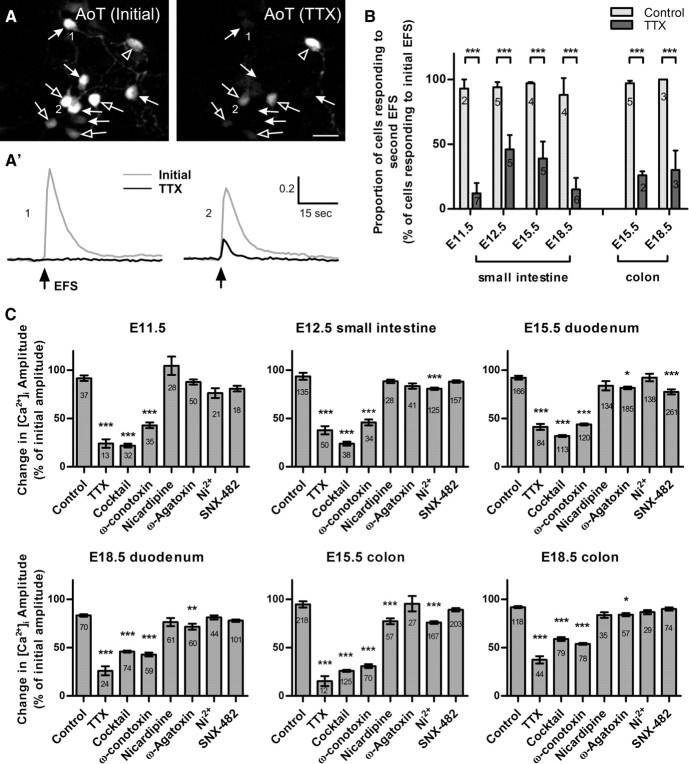
Effects of antagonists of voltage-gated ion channels. A, AoT images of the EFS response in the same cells upon an initial stimulation (left), and in the presence of TTX (right). TTX completely abolished the EFS response in ∼50% of neurons (closed arrows, cell 1). Cells that had a TTX-resistant response, showed a reduced [Ca2+]i peak amplitude (open arrows, cell 2). In very few cells, the [Ca2+]i response was not affected by TTX (open arrowhead). Scale bar, 20 μm. A′, Typical traces of responses from cells in A: 1, there is no detectable change in Fi/F0 upon EFS stimulation at t = 15 s; 2, the amplitude of the [Ca2+]i response is reduced. B, Proportion of cells (mean ± SEM) responding to an initial EFS after TTX application. The proportion was significantly reduced at all ages [***p < 0.0001; N = number of coverslips shown, Control: n = 39 (E11.5), n = 146 (E12.5), n = 171 (E15.5 small intestine), n = 75 (E18.5 small intestine), n = 6 (adult), n = 228 (E15.5 colon), n = 118 (E18.5 colon); TTX: n = 50 (E11.5), n = 94 (E12.5), n = 144 (E15.5 small intestine), n = 91 (E18.5 small intestine), n = 6 (adult), n = 45 (E15.5 colon), n = 111 (E18.5 colon)]. C, Antagonist-induced changes in amplitude of the EFS-evoked [Ca2+]i transient (mean ± SEM, calculated as proportions of the initial amplitude). TTX, the VGCC antagonist cocktail, and ω-conotoxin significantly reduced [Ca2+]i peak amplitude at all ages examined. Other antagonists produced significant reductions at various ages and gut regions (***p < 0.0001; **p < 0.001; *p < 0.05, n = number of cells for each condition shown).

