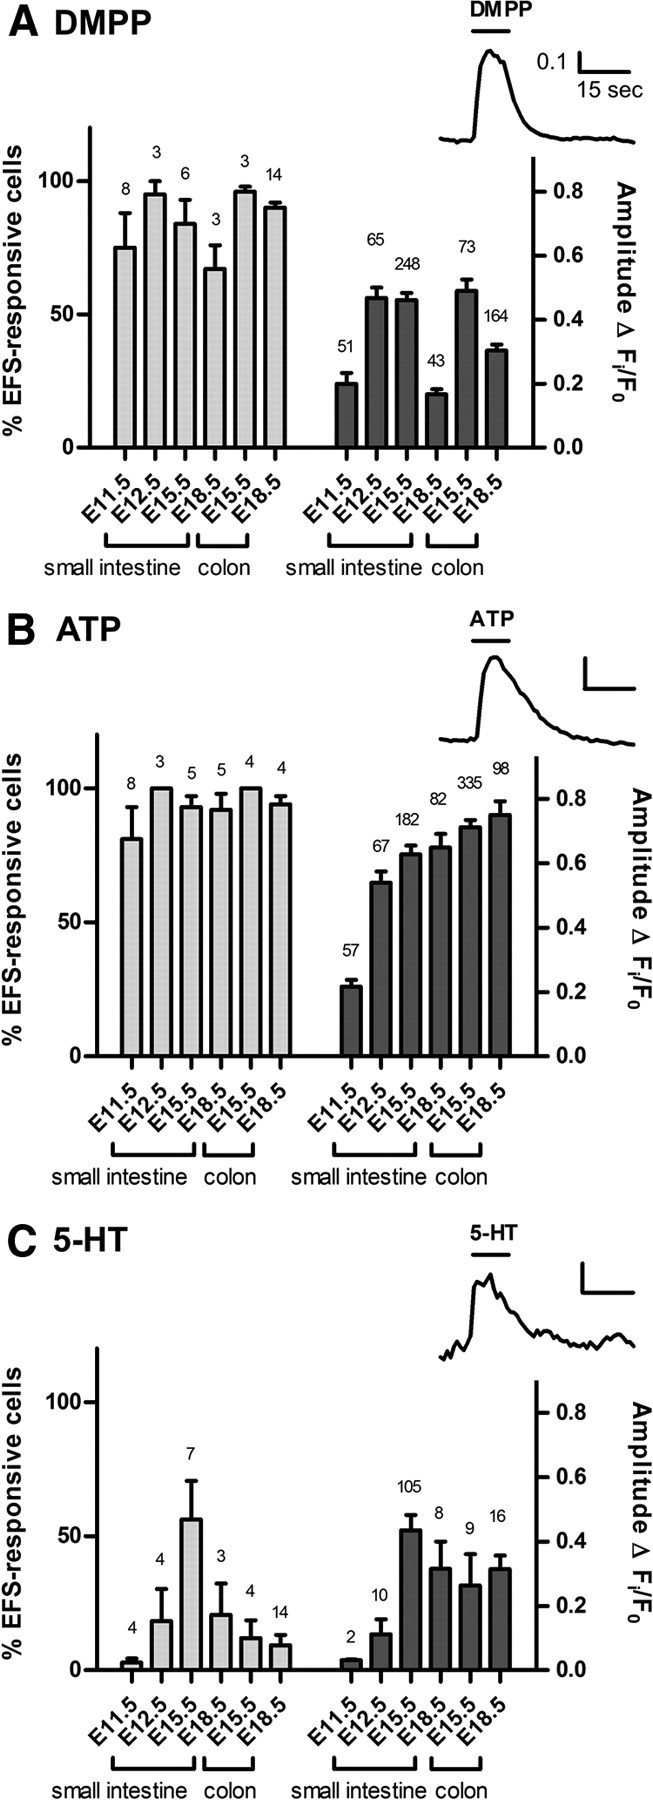
Figure 5.

Responses to neurotransmitters and receptor agonists. A–C, Cells were first stimulated with EFS to identify neurons, and then exposed to DMPP (A), ATP (B), or 5-HT (C). Insets show typical traces of the Fi/F0 responses. The proportion of EFS-responsive cells (mean ± SEM) that responded to each agonist is plotted on the left axis (N = number of coverslips shown). Right axis plots the amplitude of the agonist-evoked [Ca2+]i peak (n = number of cells responding to each agonist are shown).
