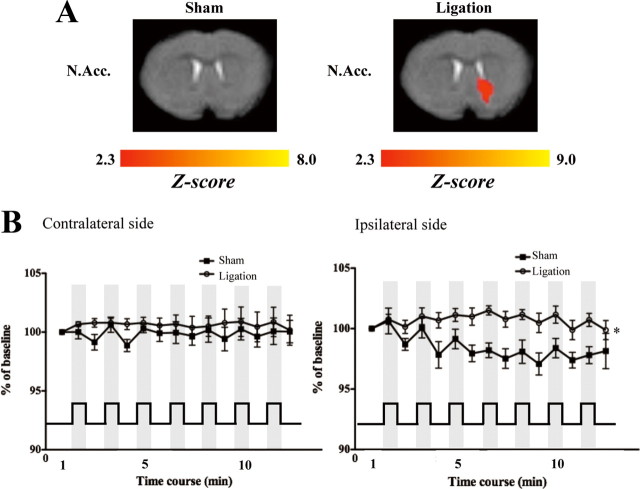
Figure 1.
Change in BOLD signal intensity following the application of heat stimuli in the ipsilateral N.Acc. at 7 d after nerve ligation. A, Representative activation maps (Z statistic images) correspond to composite images of nerve-ligated or sham-operated mice. B, BOLD signals averaged for each block period from the contralateral or ipsilateral N.Acc. The bottom line shows the time course of the heat stimulus applied to the right hindpaw. The data are expressed as percentages of the corresponding average BOLD signals in the first rest period with SEM of 6–7 mice. F(14,154) = 2.733; *p < 0.05, sham-operated mice vs nerve-ligated mice.

