
Figure 3.
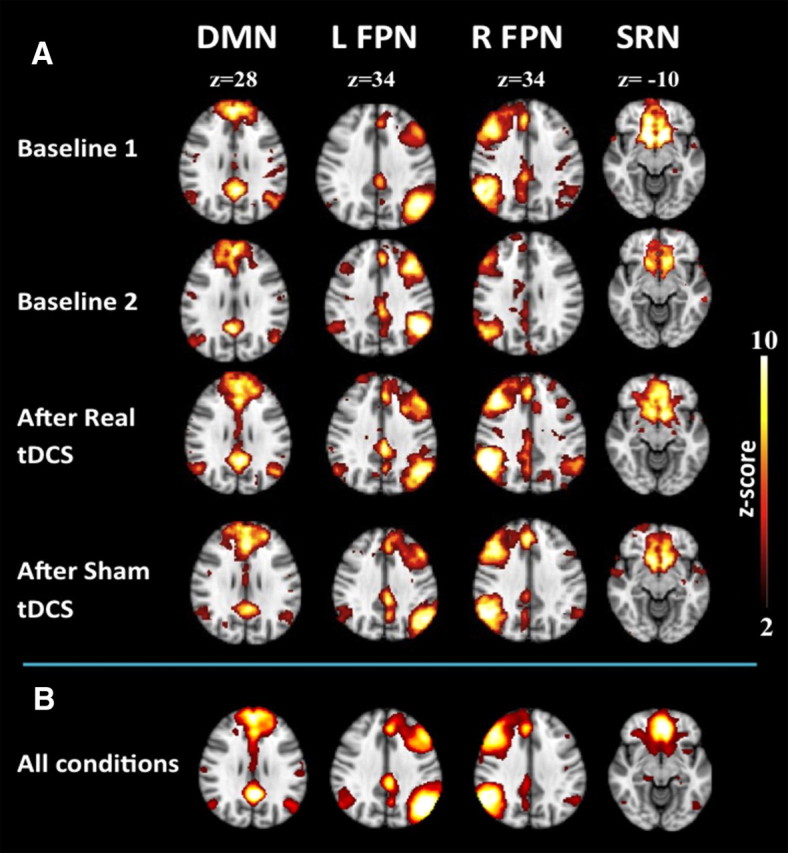
Group analysis of RSN time series. Group analysis of resting-state time series of the 13 subjects revealed four resting-state networks. A, The DMN, left FPN (L FPN), right FPN (R FPN), and SRN are shown before real tDCS, after real tDCS, and after sham tDCS, respectively. B, Group ICA RSNs derived from resting-state scans of all individuals during all conditions. Group analyses of RSN time series are shown for the conditions baseline1, baseline2, after real tDCS, and after sham tDCS.