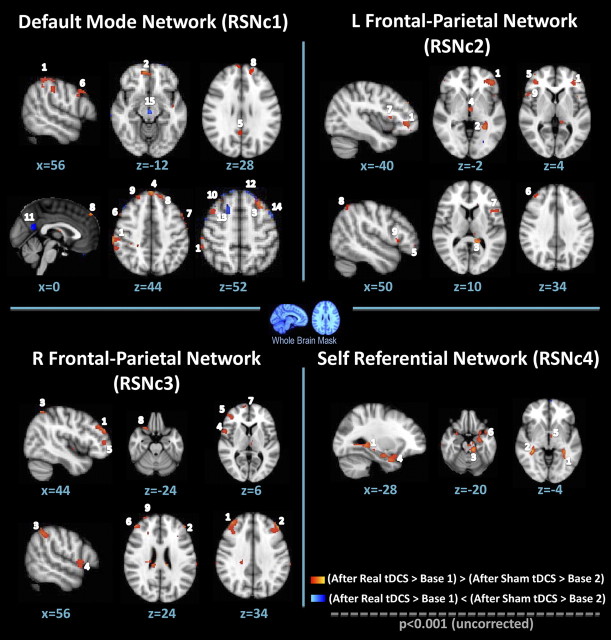
Figure 5.
Exploratory analysis of whole-brain tDCS effects. RSN contrasts resulting from the contrast baseline1 > baseline2, real tDCS > baseline12, sham tDCS > baseline12, (after real > before real) > (after sham > before sham), and inverse contrasts for each of the four networks detected after stimulation [resting-state network contrast (RSNc) 1 corresponds to the contrast on the DMN, RSNc 2 to the contrast on the left FPN, RSNc 3 to the contrast on the right FPN, and RSNc4 to the contrast of the SRN]. Numbers correspond to the clusters presented in Table 2. Red color scales represent functional correlation for the contrast (after real tDCS > baseline1) > (after sham tDCS > baseline2), and blue color represents functional correlation for the contrast after real tDCS > baseline1 < (after sham tDCS > baseline2). Radiological convention: p < 0.001 (uncorrected); cluster size, >20 voxels.

