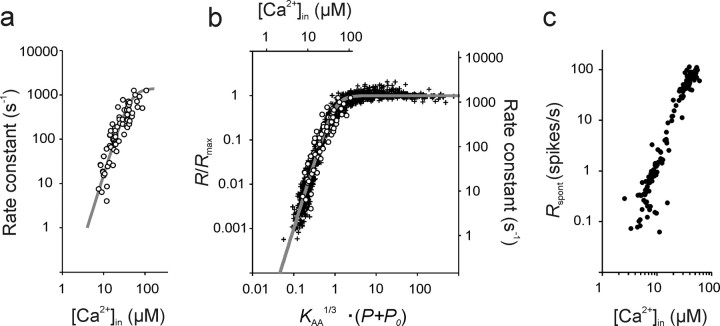
Figure 8.
Relating ANF spike rates to intracellular Ca2+ concentrations at individual active zones of inner hair cells at their resting potential. These concentrations can be estimated from the AA model applied to ANF rate–level functions in combination with measurements of IHC exocytosis as a function of the homogeneous intracellular Ca2+ concentration, [Ca2+]in (Beutner et al., 2001). a, Rate constants of exocytosis of adult mouse IHCs as a function of the homogeneous [Ca2+]in. The open symbols show the data points from Beutner et al. (2001), their Figure 3a. The gray line represents a fit of these data with a Hill equation and a Hill coefficient of β = 3 (Heil and Neubauer, 2010). b, Alignment of the data from a (upper abscissa and right ordinate) with those of the normalized firing rates of ANFs from Figure 5d (lower abscissa and left ordinate) by superposition of the common model function (gray line). This suggests the linear relationship between [Ca2+]in and tone amplitude over the range of amplitudes where spike rates are unaffected by saturation as captured by Equations 16 and 17. c, Plot of the estimates of Rspont, derived from fits of the AA model with β = 3, against the estimates of the local [Ca2+]in at the individual active zones supplying these ANFs derived from Equation 17. Note the third power relationship. For further explanation, see Results.

