
Figure 2.
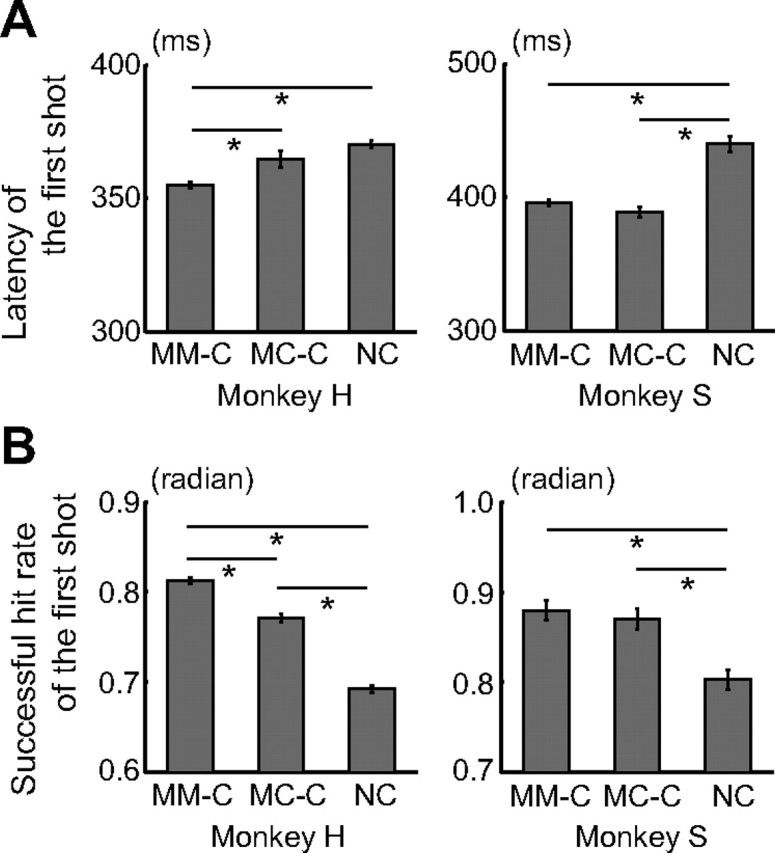
Behavioral data of the competitive and noncompetitive conditions. A, Latency of the first shot (mean ± SEM). Means of the median in each session were compared among the conditions. One-way ANOVA demonstrated a significant difference in latency among the three conditions (monkey H: F(2,278) = 181.2, p < 10−10; monkey S: F(2,416) = 51.4, p < 10−10). Post hoc paired comparisons were conducted using a Bonferroni's-corrected, two-tailed t test (*p < 0.05). Monkey H: n = 126 (Mon–Mon), 29 (Mon–Com), and 126 (noncompetition). Monkey S: n = 195 (Mon–Mon), 29 (Mon–Com), and 195 (noncompetition). B, Successful hit rate of the first shot (mean ± SEM). Data were normalized by the arcsine transformation before statistical analyses. One-way ANOVA demonstrated a significant difference in the successful hit rate among the three conditions (monkey H: F(2,278) = 154.5, p < 10−10; monkey S: F(2,416) = 15.5, p < 10−6). Post hoc paired comparisons were conducted using a Bonferroni's-corrected, two-tailed t test (*p < 0.05). Monkey H: n = 126 (Mon–Mon), 29 (Mon–Com), and 126 (noncompetition). Monkey S: n = 195 (Mon–Mon), 29 (Mon–Com), and 195 (noncompetition). MM-C, Mon–Mon competitive condition; MC-C, Mon–Com competitive condition; NC, noncompetitive condition.