
Figure 6.
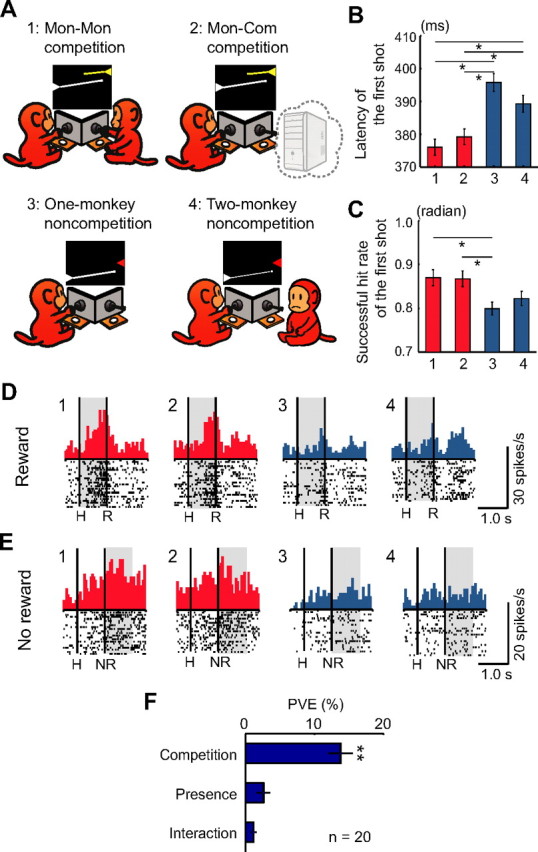
Effects of competition and the presence of another monkey on monkey behavior and LPFC neuronal activity. A, Schematic diagrams of the Mon–Mon competitive (1), Mon–Com competitive (2), One-monkey noncompetitive (3), and Two-monkey noncompetitive (4) conditions. In the Two-monkey noncompetitive condition, there were two monkeys in the experimental booth, but only one monkey played a noncompetitive game, whereas the other monkey did not participate in the game. B, C, Latencies and successful hit rates of the first shot were compared among the four (Mon–Mon competition, Mon–Com competition, One-monkey noncompetition, and Two-monkey noncompetition) conditions. B, Latency of the first shot (mean ± SEM). One-way ANOVA demonstrated a significant difference in latency among the four conditions (F(3,92) = 12.86, p < 10−6). Post hoc paired comparisons were conducted using a Bonferroni's-corrected, two-tailed t test (*p < 0.05). n = 24 (each condition). C, Successful hit rate of the first shot (mean ± SEM). Data were normalized by the arcsine transformation before statistical analyses. One-way ANOVA demonstrated a significant difference in successful hit rate among the four conditions (F(3,92) = 4.29, p = 0.007). Post hoc paired comparisons were conducted using a Bonferroni's-corrected, two-tailed t test (*p < 0.05). n = 24 (each condition). D, E, Examples of neurons that showed greater activity in reward trials (D) and in no-reward trials (E) during the competitive compared with during the noncompetitive conditions. Neuronal activities during reward trials (D) and no-reward trials (E) under each condition are shown. Each shaded area indicates the period when typical activity in relation to competition and the presence of another monkey was observed. The configuration of each raster and histogram display is the same as in Figure 3A–C. For B–E: 1, Mon–Mon competition; 2, Mon–Com competition; 3, One-monkey noncompetition; 4, Two-monkey noncompetition. F, Mean PVE for the competitive neurons that were recorded in the four conditions. The plot shows the averaged PVE of each factor in the two-way ANCOVA (competition and presence factors and their interaction) (mean ± SEM). We used a two-tailed Mann–Whitney U test to determine whether these PVE values were significantly greater than the chance level by comparing them with those calculated from the randomized data. **p < 10−7.