Figure 3.

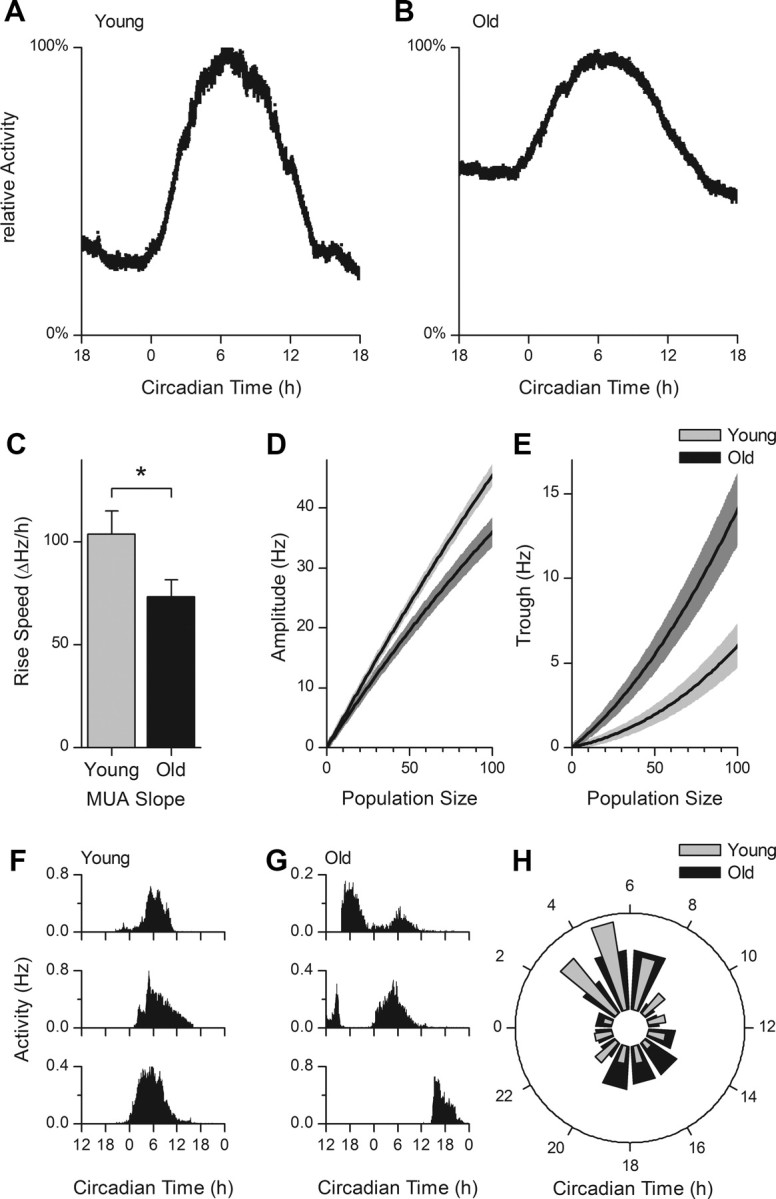
Extracellular recordings of electrical activity in brain slices from young and old animals. A, B, Examples of normalized MUA patterns as a function of CT. In slices from old animals, a higher trough level is observed. C, The rising slope of the multiunit electrical discharge pattern is reduced in old animals (old, 73.21 ± 8.29 ΔHz/h; young, 104.02 ± 10.97 ΔHz/h; *p < 0.05). D, Average ± SEM rhythm amplitude as a function of population size. The difference in trough to peak amplitude increases with increasing population size (at level 100: old, 35.95 ± 1.84 Hz; young, 45.43 ± 1.12 Hz; p < 0.01). E, The lower amplitude in slices from old animals is directly attributable to an increase in the trough in old animals (at level 100: old, 14.08 ± 1.81 Hz; young, 6.01 ± 1.10 Hz; p < 0.01). F, G, Raw subpopulation activity (in hertz) profiles, recorded from young (F) and old (G) animals, as a function of CT (hours). Multiple subpopulation peak times were observed in old mice. In young mice, most subpopulations had an activity peak during projected midday (CT6). H, The time of maximal activity of small neuronal subpopulations are displayed in a phase histogram, with the midday corresponding with CT6. In young animals, there is a significant difference in the number of subpopulation peaks in the day versus night (p < 0.01). In old animals, however, a large number of subpopulations have their peak at night, and there is no significant difference in the number of active populations during the day and night (p = 0.72).
