
Figure 2.
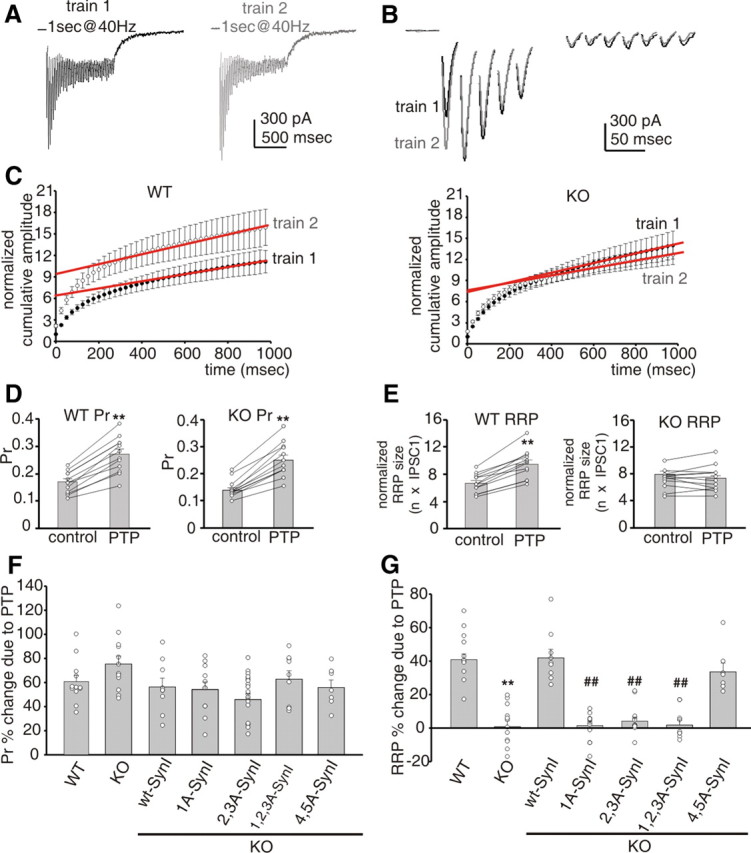
A, PTP is associated with an increased Pr and a concomitant increase in RRP size dependent on PKA/CaMK phosphorylation of SynI. Representative stimulation trains (1 s at 40 Hz), applied at a time interval of 10 s, were used to estimate changes in Pr and RRP size responsible for PTP induction in a WT neuron. B, A detail of the first five and last seven eEPSCs in response to the first (black trace) and second (gray trace) train. Stimulation artifacts were blanked. C, Mean cumulative eEPSC plots showing the changes induced by PTP in WT (left; n = 9) and KO (right; n = 12) neurons. To estimate the RRP, data points in the linear range of the curves were fitted by linear regression and back-extrapolated to time 0 (red lines). D, E, Graph histograms show mean (± SEM) Pr (D) and normalized RRP (E) sizes before (control) and 10 s after PTP induction in WT (left; n = 9) and KO (right; n = 12) neurons. Superimposed symbols connected by lines represent individual Pr and RRP values. **p < 0.01 versus control, paired Student's t test. F, G, Mean percentage changes (± SEM) in Pr (F) and RRP (G) sizes induced by PTP. Superimposed symbols represent individual changes in Pr and RRP observed in WT neurons (n = 12), KO (n = 12) neurons, and KO neurons expressing either wt-SynI (n = 9) or its phosphomutant forms (1A-SynI, n = 17; 2,3A-SynI, n = 22; 1,2,3A-SynI, n = 9; 4,5A-SynI, n = 7). One-way ANOVA followed by Bonferroni's multiple-comparison test. **p < 0.01 versus WT; ##p < 0.01 versus SynI.