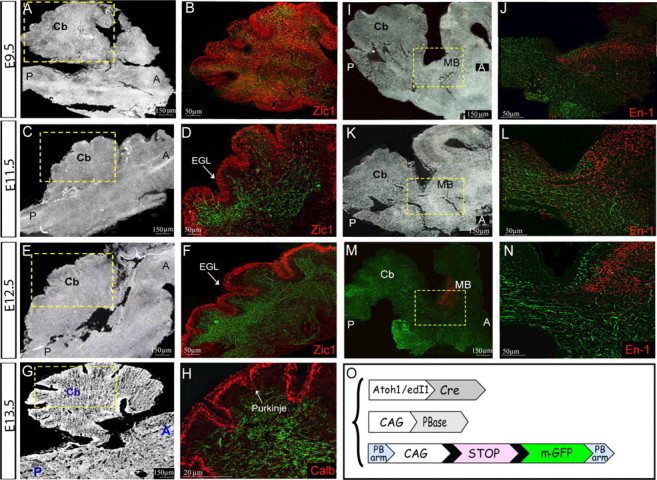
Figure 5.

dA1 axonal projections in the cerebellum and midbrain. Sagittal sections of the brainstem, cerebellum and midbrain regions at E9.5 (A, B, I, J), E11.5 (C, D, K, L), E12.5 (E, F, M, N) and E13.5 (G, H) of embryos that were electroporated with the PiggyBac system to label dA1 axons. Boxed areas in A, C, E, G, I, K, M are shown as enlargements in panels B, D, F, H, J, L, N, respectively. A, C, E, G, I, K, Bright-field images of sections. B, D, F, H, J, L, N, Fluorescent images demonstrating axonal tracts (green) and Zic1 (B, D, F), Calbindin (H), and En-1 (J, L, N) immunolabeling (red). Stages, antibodies, anatomical axes, and landmarks are indicated in all panels. Scale bars are indicated. Cb, cerebellum; MB, midbrain; EGL, external granular layer; Calb, calbindin; A; anterior, P; posterior. O, A scheme of the constructs; mGFP-LoxP cassette is flanked by two PB arms. The integration of the reporter cassette into the genome and the expression of mGFP in dA1 neurons is driven by CAG::PBase and Atoh1::Cre/EdI1::Cre.
