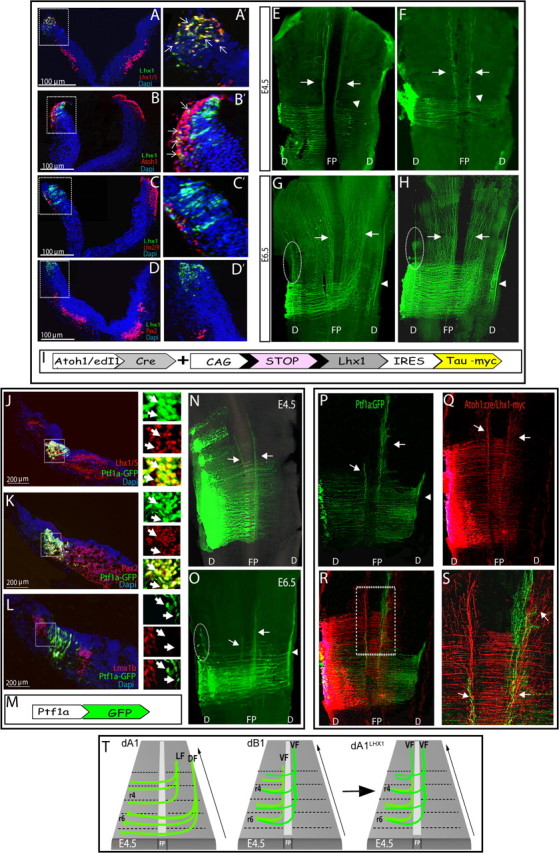
Figure 7.

Alterations in dA1-axonal patterns by modification of the Lim-HD code. A–H, E2.5 hindbrains were electroporated with Atoh1 enhancer::Cre (A–E,G), or edI1 enhancer::Cre (F,H), and conditional Lhx1-taumyc plasmids. A–D, Transverse sections of E3.5 hindbrains examined for the distribution of dorsal interneurons, using antibodies against Lhx1/5 (A), Atoh1 (B), Lhx2/9 (C), and Pax2 (D). A′–D′, Enlargement views of the boxed areas in A–D to show the electroporated regions of the hindbrain. Arrows point at representative neurons that coexpress taumyc and the examined interneuron marker. Scale bars are indicated. E–H, Flat-mounted views of E4.5 (E, F) or E6.5 (G, H) hindbrains that were electroporated with showing axons of dA1 neurons expressing Lhx1. Arrows indicate ipsilateral and contralateral axons that ascend adjacent to the midline, arrowheads indicate axons that continue to grow laterally after crossing the midline and turn rostrally, and circled areas indicate dorsal ipsilateral ascending tract. I, A scheme of the plasmid used in A–H; Expression of Lhx1 and taumyc (pCAGG-LoxP-STOP-LoxP-Lhx1-IRES-taumyc) are driven by Atoh1::Cre or edI1::Cre. J–O, E2.5 hindbrains were electroporated with Ptf1a::GFP-expressing plasmid. J–L, Transverse sections of E3.5 hindbrains stained with antibodies against Lhx1/5 (J), Pax2 (K) and Lmx1b (L). Boxed areas in J–L are represented in their different channels in magnified views to the right of each image, respectively. Arrows point at representative Ptf1a::GFP-expressing neurons. Scale bars are indicated. N, O, Flat-mounted views of E4.5 (N) and E6.5 (O) hindbrains showing axonal trajectories of neurons expressing Ptf1a::GFP. M, A scheme of the plasmid used in J–O; expression of GFP is driven by Ptf1a enhancer. P–S, Flat-mounted views of E5 hindbrains coelectroporated with Ptf1a::GFP (P) and Atoh-cre::conditional Lhx1-taumyc (Q) plasmids (shown in I, M). R, A merged image of P, Q demonstrating colocalization of axons shown in P, Q. S, Magnified view of the boxed area in R. T, A schematic summary representing either the typical dA1 axonal projections, the typical dB1 axonal projections, or the dA1Lhx1 axonal tracts in E4.5 hindbrain. In all images, stages, antibodies, and plasmids are indicated. In all sections, scale bars are indicated. DF, dorsal funiculus; LF, lateral funiculus; VF, ventral funiculus; FP, floor plate; D, dorsal; r, rhombomere.
