
Figure 5.
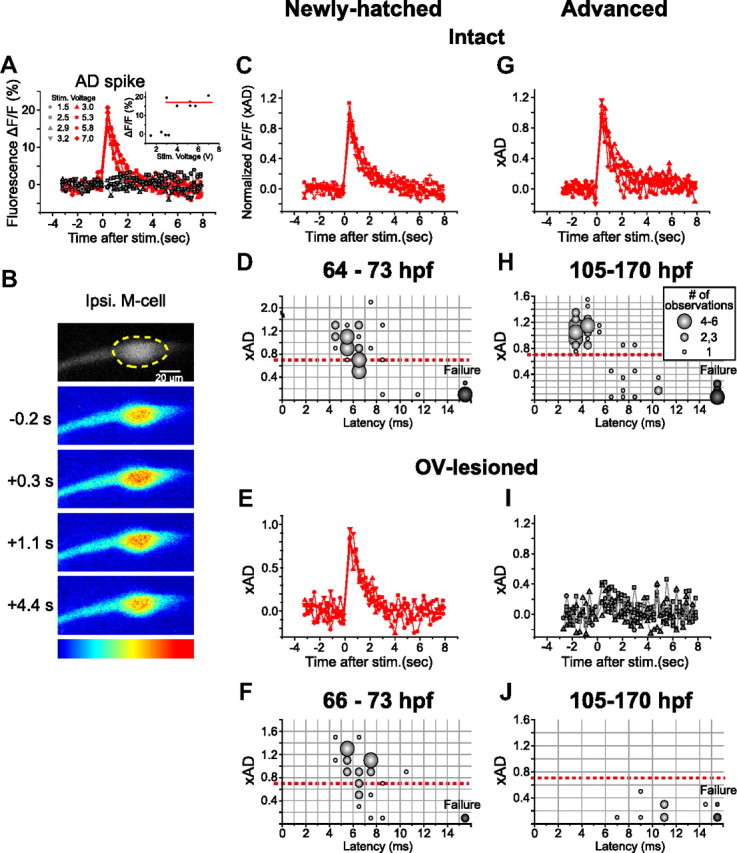
Spiking of the M-cell in newly hatched and advanced larvae. A, Fluorescence responses associated with an AD spike of an M-cell at 69 hpf in response to electrical stimulation applied to the spinal cord. Fractional changes in fluorescence intensity (ΔF/F; ordinate) of the M-cell soma as shown in B were plotted against the time elapsed since the stimulus (abscissa). The changes in response to different stimulus intensities (volts) occurred in an all-or-nothing manner. Inset, The constant amplitude at suprathreshold stimulus intensities (average, 17.1%; indicated by red line, used to normalize the fluorescence responses shown in C) is consistent with the generation of a single AD spike. B–J, Fluorescence response of the M-cell soma (dotted circle in B) in association with fast escape. B, Fluorescence response of the same M-cell as in A, observed simultaneously with fast escape elicited by a water pulse applied to the ipsilateral OV. Pseudocolored fluorescence images (blue, lowest; red, highest) before (−0.2 s) and after (+0.3, 1.1, and 4.2 s) the stimulus are shown. C, Fluorescence responses associated with fast escape were superimposed (5 traces from the 69 hpf larva shown in A and B). The response amplitude was normalized with the value associated with the AD response (xAD). Peak amplitudes comparable with those of the AD response (0.99–1.27 xAD) suggest that the M-cell fired once during fast escape. Data points indicated by red squares were obtained from the trial shown in B. G, The M-cell in an advanced larva (132 hpf) also showed suprathreshold fluorescence response in association with fast escape (5 trials). D, H, Bubble chart representation of the relationship between escape onset latency (abscissa) and accompanying fluorescence response amplitude of the ipsilateral M-cell (ordinate) at 64–73 hpf (D) and 105–170 hpf (H). The size of the bubbles represents the number of observations (inset in H is also applicable to D, F, and J) in each bin (indicated by gray lines). Response above the threshold (red dotted line; 0.7 xAD) was thought to represent firing, as demonstrated previously (Kohashi and Oda, 2008). E, I, Suprathreshold and subthreshold fluorescence responses of the M-cell, associated with fast escape after OV lesion, in a newly hatched larva (E, 4 responses from a 73 hpf larva) and advanced larvae (I, 5 traces from 3 130–147 hpf larvae), respectively. F, J, Bubble chart representation of the relationship between M-cell activity and escape latency in OV-lesioned larvae. In contrast to newly hatched larvae (F, 66–73 hpf), advanced larvae (J, 105–170 hpf) never showed suprathreshold response in the M-cell after OV lesion.