
Figure 6.
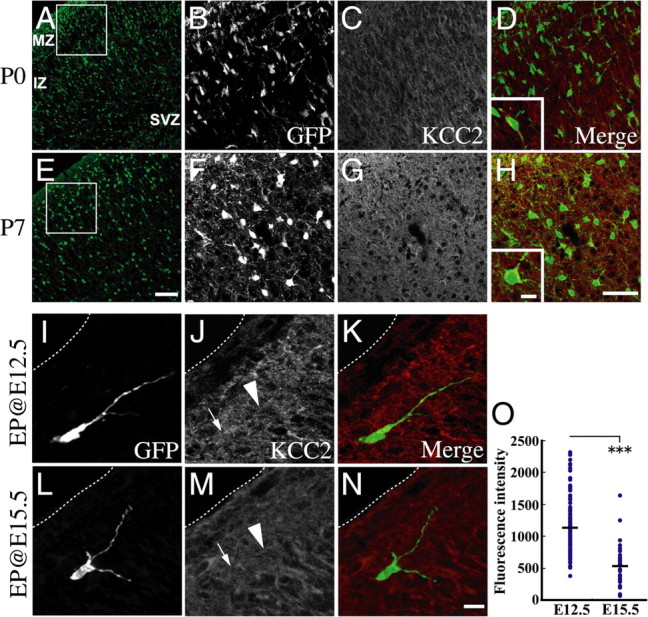
KCC2 immunoreactivities of interneurons. A–H, Immunoreactivity for GFP (A, B, E, F) and KCC2 (C, G) of the same region in P0 (A–D) and P7 (E–H) GAD mice cortex. D and H show merged images of GFP and KCC2 immunostaining. B–D and F–H show magnified images of the boxed areas in A and E, respectively. KCC2 immunoreactivities in P7 cortical interneurons are higher compared with P0 interneurons. Insets in D and H show high-magnification views of merged views illustrating KCC2 expression (red) by interneurons (green). I–O, Immunoreactivity for KCC2 in E12.5 and E15.5 electroporated cells. pCAGGS-EGFP was electroporated into the ganglionic eminence of E12.5 or E15.5 embryo of wild-type animals, and cortices were fixed at E18.5. I–N, Representative cells of KCC2 immunoreactivities in each electroporated condition. I–K, E12.5 electroporated cells. L–N, E15.5 electroporated cells. K and N show merged images of GFP (I, L) and KCC2 (J, M) staining. Arrows indicate cell bodies and arrowheads indicate processes. Dashed lines indicate the pial surface. O, Quantitative analysis of KCC2 fluorescence intensity in electroporated cells. GFP-positive cells located within the 60 μm from pial surface were collected). Average intensity of KCC2 expression in electroporated cells was calculated in each electroporated condition. Fluorescence was measured in 12 bits (value range of 0–4095). Each dot shows the intensity of each electroporated cell and bars indicate the average value. Early-born cortical interneurons exhibited significantly higher fluorescence intensity of KCC2 immunoreactivity (***p < 0.001, Mann–Whitney U test). Data were analyzed from 4 cortices. Number of cells: E12.5 electroporated cells, 115 cells; E15.5 electroporated cells, 32 cells. Scale bars: 100 μm (A, E); 50 μm (B–D, F–H); 10 μm (I–N); inset in H, 10 μm.