Figure 3.
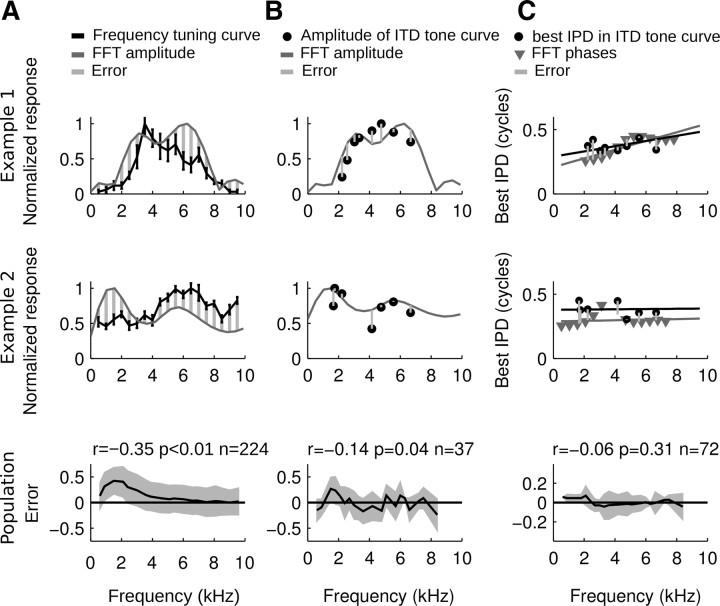
Mismatches between responses to tone stimuli and linear decomposition (FFT) of noise-delay curves. A, Comparison between the frequency-tuning curves obtained with tone stimuli presented at a neuron's best ITD and the FFT amplitude spectra of noise-delay curves. Top and Middle, Frequency-wise error computation for the example neurons of Figure 2. The curves were matched by normalizing the FFT amplitude spectrum to cover the dynamic range of the frequency-tuning curve (i.e., baseline activity to maximum response rate). The maximum rates were set to 1. Bottom, Averaged errors in a population of AAR neurons. Positive values indicate a larger estimate of the FFT amplitude spectrum than that measured with tone stimuli. Note that FFT results predict systematically higher amplitudes in the low-frequency range. B, FFT amplitude spectra compared frequency-wise to the maximal response rates obtained in tone-delay curves. Top and middle, Error computation for the example neurons of Figure 2. Normalization as in A. Bottom, Note that the population error only weakly correlates with frequency. C, Frequency-wise comparison of phase data obtained from tone-delay curves and FFT phase spectra of noise-delay curves. Top and middle, Error computation for the example neurons of Figure 2. Black and dark gray lines, Regressions through phase data. Bottom, The population error is small and frequency-independent.

