Figure 4.
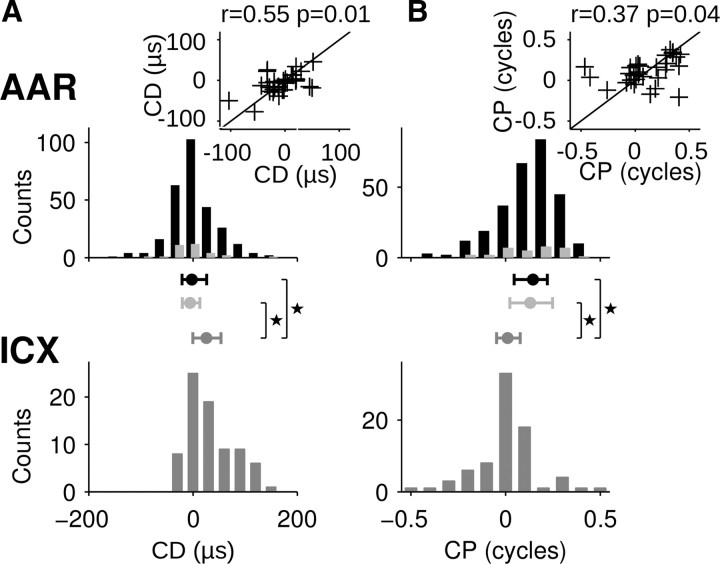
Distribution of characteristic phases and delays in the forebrain AAR and midbrain ICX. A, Top, CD distributions in AAR estimated from AAR tone-delay curves (light gray symbols, n = 32) and from FFTs of noise-delay curves (black symbols, n = 279). The distributions from tone-delay or noise-delay curves did not differ significantly (Kolmogorov–Smirnov test; p > 0.5). Inset, CDs obtained from FFTs of noise-delay curves as a function of CDs obtained from tone-delay curves in a subpopulation of neurons (n = 30). Black line represents the identity line. Bottom, CDs obtained from FFTs of noise-delay curves recorded in the midbrain ICX (dark gray symbols, n = 77). Center, The 25–75 percentile range of the distributions (whisker) and medians (circles). CD distributions in AAR and ICX differed significantly (asterisks, Kolmogorov–Smirnov test; p < 0.01). B, CP distributions in AAR and ICX. Data are plotted following the same conventions as in A. Note that CP distributions differed significantly between AAR and ICX (asterisks, two-sample Kuiper's test; p < 0.01).

