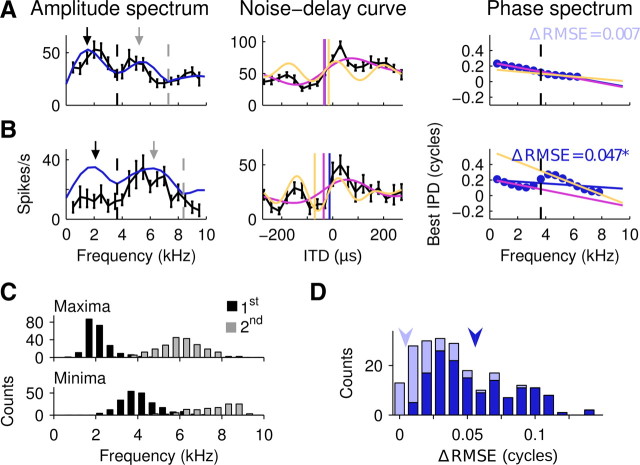
Figure 5.
Low-frequency and high-frequency ranges feature band-limited CPs and CDs. A, Unit with linear phase–frequency relation. Left, Amplitude spectrum (blue line) and frequency-tuning curve (black line) both display a local minimum used to divide the range in low and high frequencies (dashed black line). Maxima are indicated by arrows and minima by dashed lines. Middle, Noise-delay curve (black). Band-limited CDs computed over the low-frequency range (violet), the high-frequency range (yellow), and the entire range (blue line) are indicated as straight lines. Violet and yellow curves indicate the linear estimate of the contribution to ITD sensitivity by the low-frequency range and high-frequency range, respectively. The linear estimate is a band-limited inverse Fourier transform computed as the sum of cosine functions across the low-frequency or high-frequency range weighted by the respective FFT amplitudes and phase-shifted according to the phase spectrum. Right, Phase spectrum regressions were computed over the low-frequency range (violet), the high-frequency range (yellow), and the entire range (blue line). No significant difference in the RMSE between a single regression and regressions through low-frequency and high-frequency ranges (ΔRMSE) was observed (CDs, −33, −16, −32 μs; CPs, 0.25, 0.16, 0.24 cycles for low-frequency, high-frequency, and broad-frequency ranges, respectively). B, Conventions as in A. Note that this neuron exhibited a major discontinuity in the phase–frequency relation at the frequency of its first minimum in the amplitude spectrum. Accordingly, CDs and CPs differed more strongly for low-frequency, high-frequency, and broad-frequency ranges (CDs, −35, −71, −12 μs; CPs, 0.21, −0.42, 0.2 cycles, respectively). C, Distribution of the first two local maxima (top) and minima (bottom) in the amplitude spectra, n = 230 (n = 131 for second local minimum). D, Stacked histogram of ΔRMSE values obtained by computing a single regression over the phase data versus regressions in the low-frequency and the high-frequency ranges separately (n = 230). Light blue and dark blue bars represent nonsignificant and significant reductions in RMSE, respectively (bootstrap test, p < 0.01). Arrowheads indicate ΔRMSE values measured in the example neurons in A (light blue) and B (dark blue).

