Figure 6.
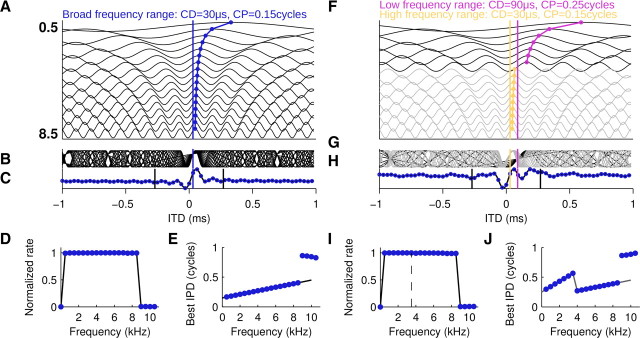
Linear integration model for noise-delay curves. Phase–frequency relations were determined either by a broadband CD–CP pair (A–E) or by two band-limited CD–CP pairs in the low-frequency and the high-frequency ranges (F–J). A, Tone-delay curves modeled as cosine functions were offset along the y-axis as a function of frequency (values in kHz). CD is indicated by the blue line. Peak responses close to zero are connected by a blue curve to emphasize the frequency-dependent shift due to the CP. B, Superimposed tone-delay functions. Note that the curves align at the CD. C, Noise-delay function modeled as sum of the tone-delay curves. Straight black lines mark the range of ITDs sampled under experimental conditions. Blue circles, Sampled ITD signal for discrete Fourier analysis. D, Frequency-tuning curve modeled as window function evaluated between 0 and 32 kHz in steps of 0.5 kHz equaling 1 between 0.5 and 8.5 kHz and 0 everywhere else (black line). Amplitude spectrum of the full-length noise-delay function was superimposed (blue circles). E, Phase–frequency tuning (black line) and superimposed phase spectrum (blue circles). F–J, Conventions as in A–E. Tone-delay curves in the high-frequency range in light gray. Low-frequency CD in violet. High-frequency CD in yellow. Note that the discontinuity in the phase–frequency relation has no effect on the amplitude spectrum (cf. Fig. 7B).

