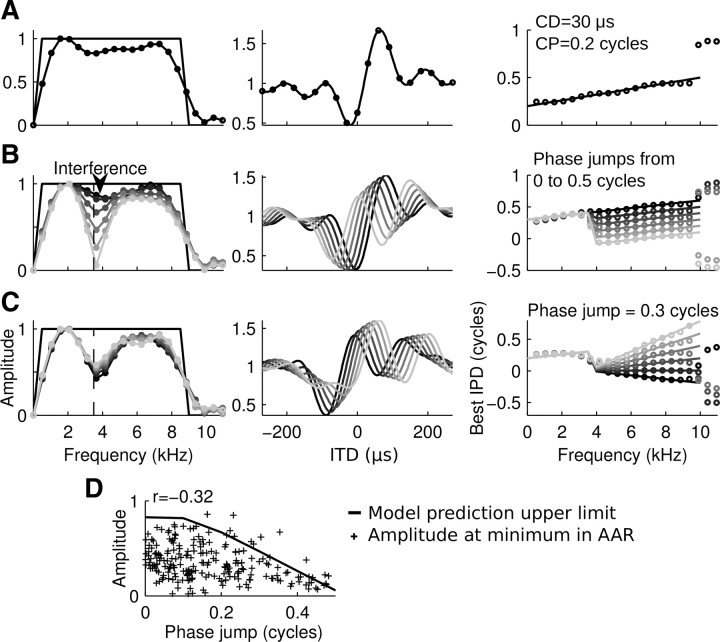
Figure 7.
Phase jumps cause systematic changes in the amplitude spectra of short noise-delay curves. Segments of model noise-delay curves shown between ±270 μs and their FFT spectra. Left column, Original frequency tuning (black line) and amplitude spectra of noise-delay curves (circles, gray shades indicate unit identity). Middle column, Model noise-delay curves were sampled according to experimental conditions (±270 μs, 30 μs steps; A, black circles). Right column, Original phase–frequency relation (lines) and FFT phase spectra of noise-delay curves (circles). A, Model unit with CD = 30 μs and CP = 0.2 cycles. The amplitude spectrum of the short noise-delay curve appeared as a filtered version of the original frequency-tuning curve. The phase spectrum deviated only slightly from the original signal at frequencies <9 kHz. B, Model units with band-limited CDs and CPs. Note that phase jumps in the phase–frequency function were reflected as local minima in the amplitude spectrum due to a combined effect of spectral leakage and interference. C, Model units with fixed phase jumps of 0.3 cycles. Varying CDs and CPs did not affect the amplitude spectrum further. D, Correlation of local minima and phase jumps in amplitude and phase spectra of noise-delay curves in 230 AAR units compared with the prediction from modeled noise-delay curves. Phase jumps were computed as the absolute phase difference between the regressions through the low-frequency and high-frequency phase data at the frequency of the local minimum in the amplitude spectrum.

